Recordings
Multiplayer recordings capture everything: frontend screens, user actions, backend traces, metrics, logs, and full request/response content and headers.
This is the full-stack, unsampled, pre-correlated data that powers the debugging agent.
When using the debugging agent CLI, recordings of errors and exceptions are automatically captured, deduplicated, triaged, and fed to your preferred coding agent to generate an accurate fix.
Recordings can also be captured on-demand, manually, using the browser extension orin-app widget.
Recordings web dashboard
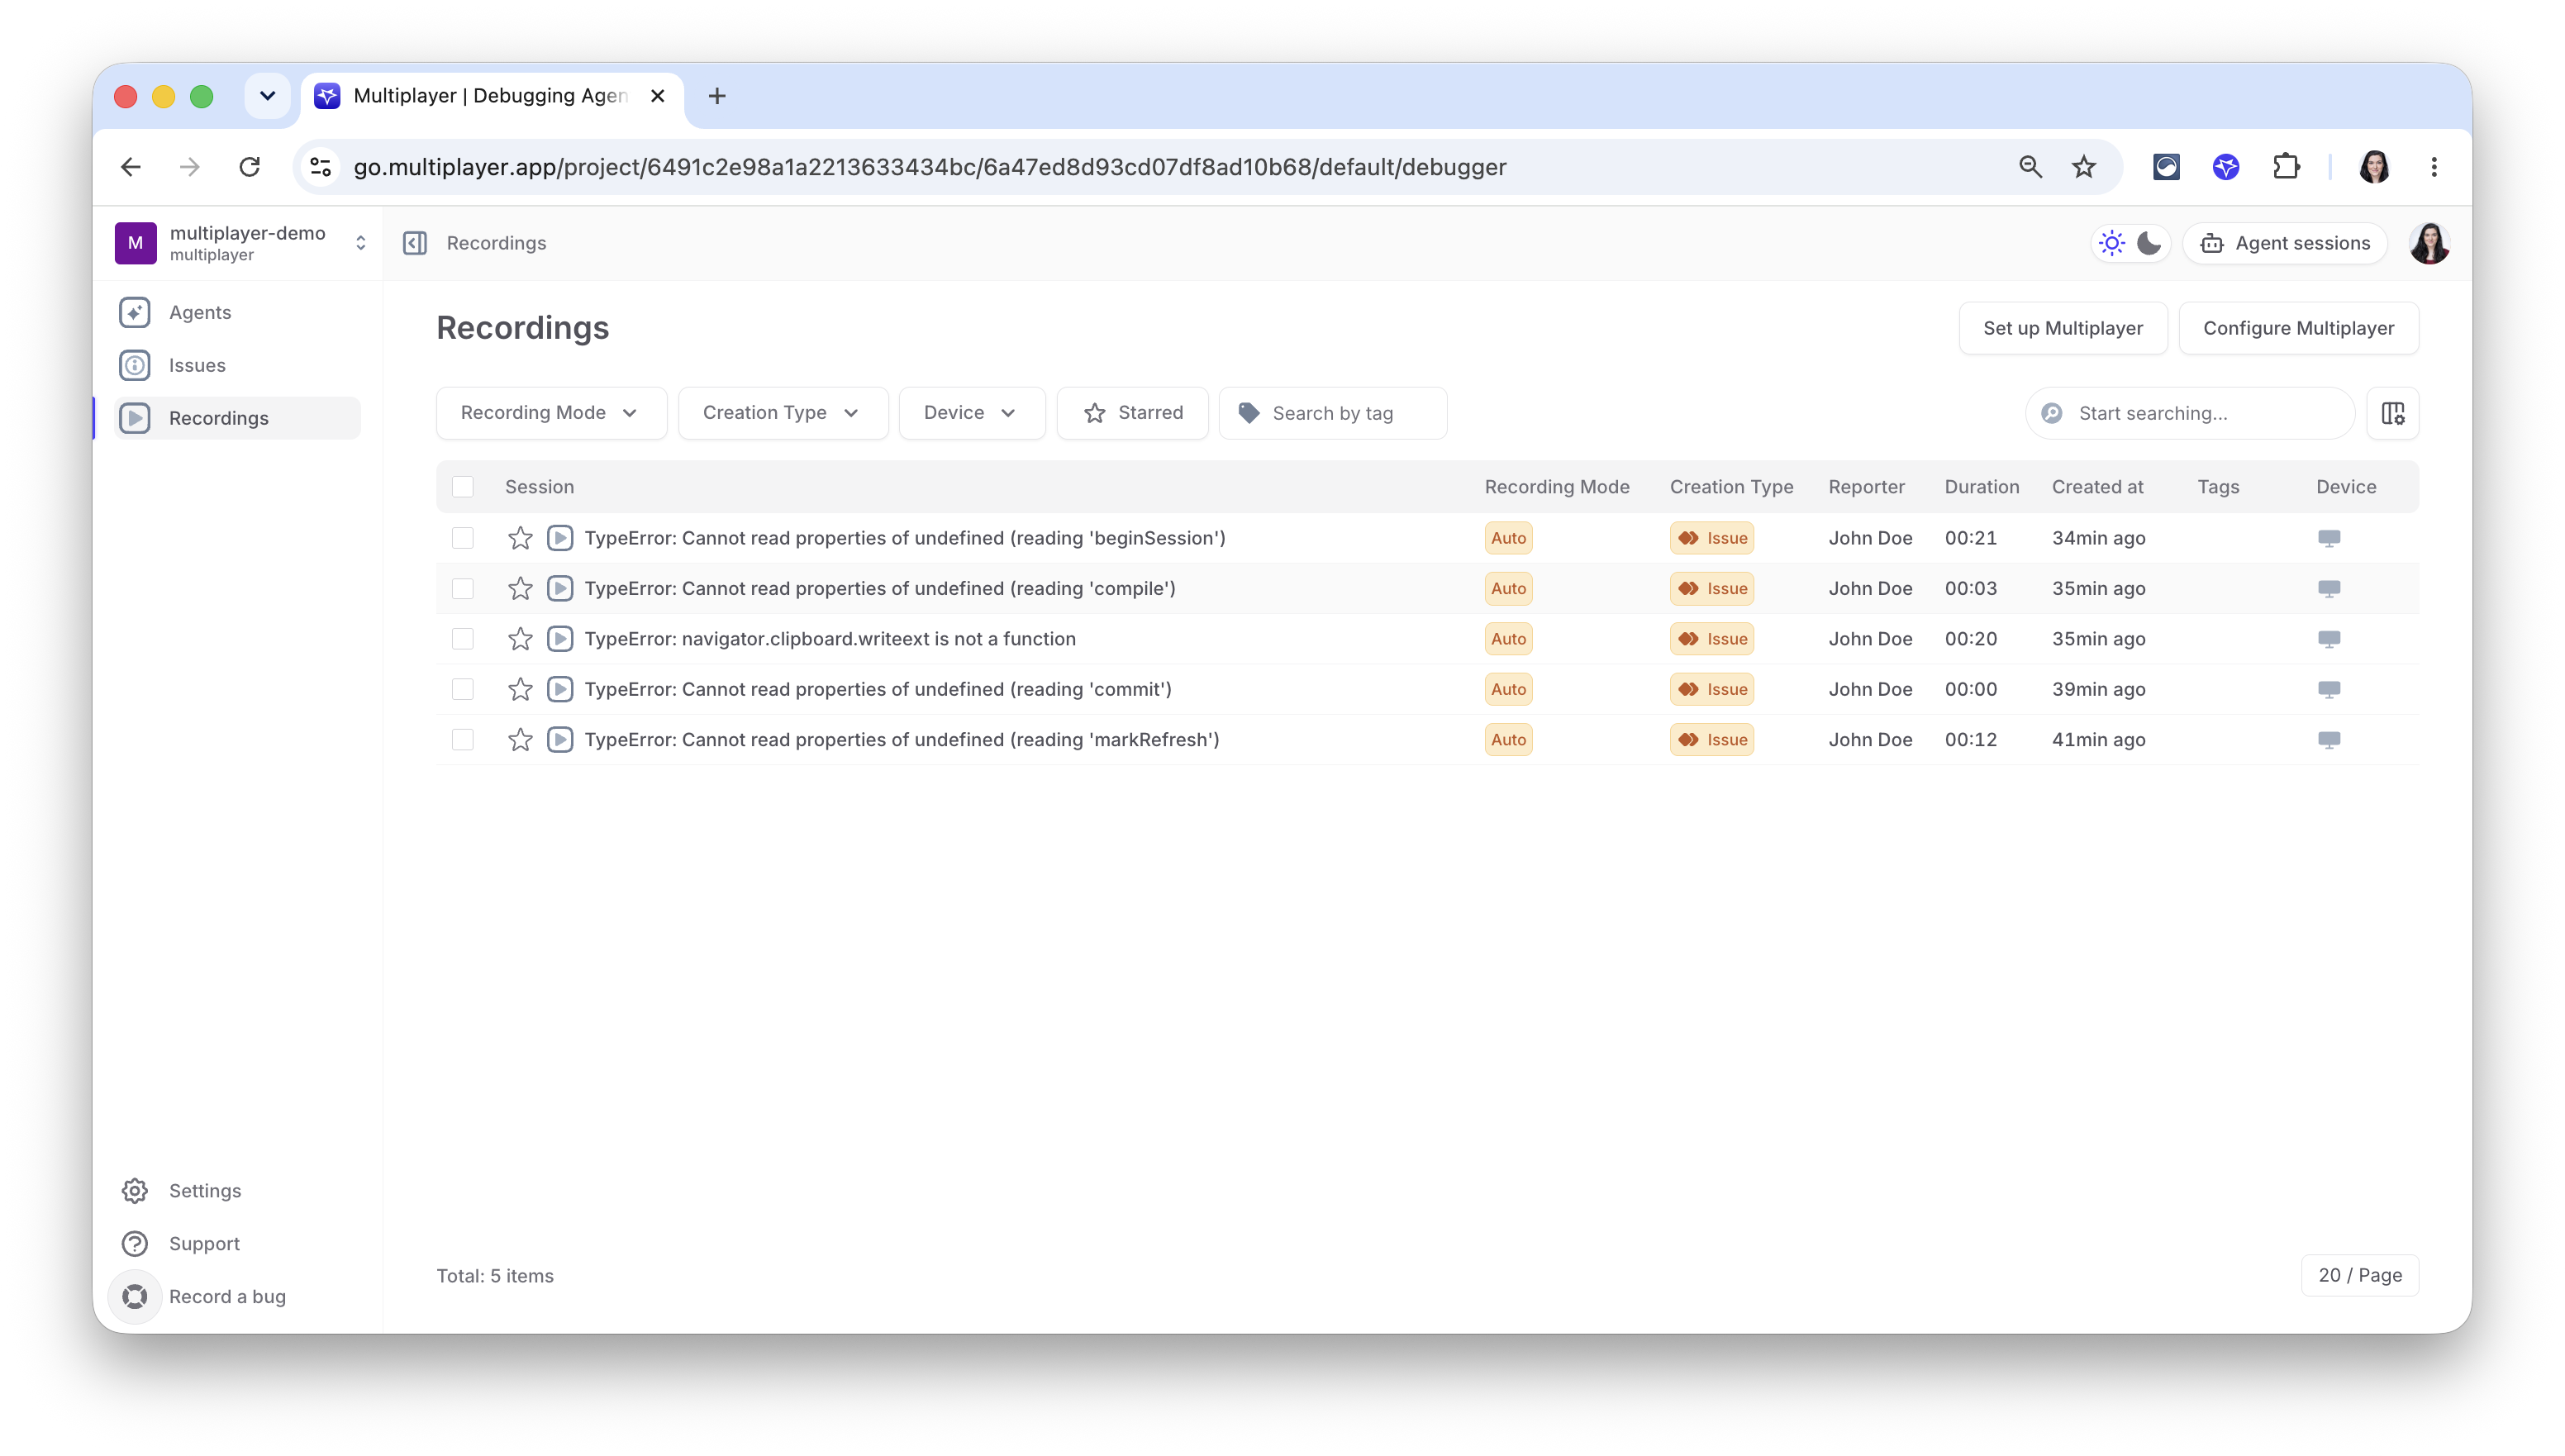
Each row is one recording: whether it was captured automatically or manually, what created it, who reported it, how long it ran, when, and on what device.
Filter by recording mode, creation type, device, or starred status, or search by tag. This is every recording, whether or not it became an issue.
Inside a recording
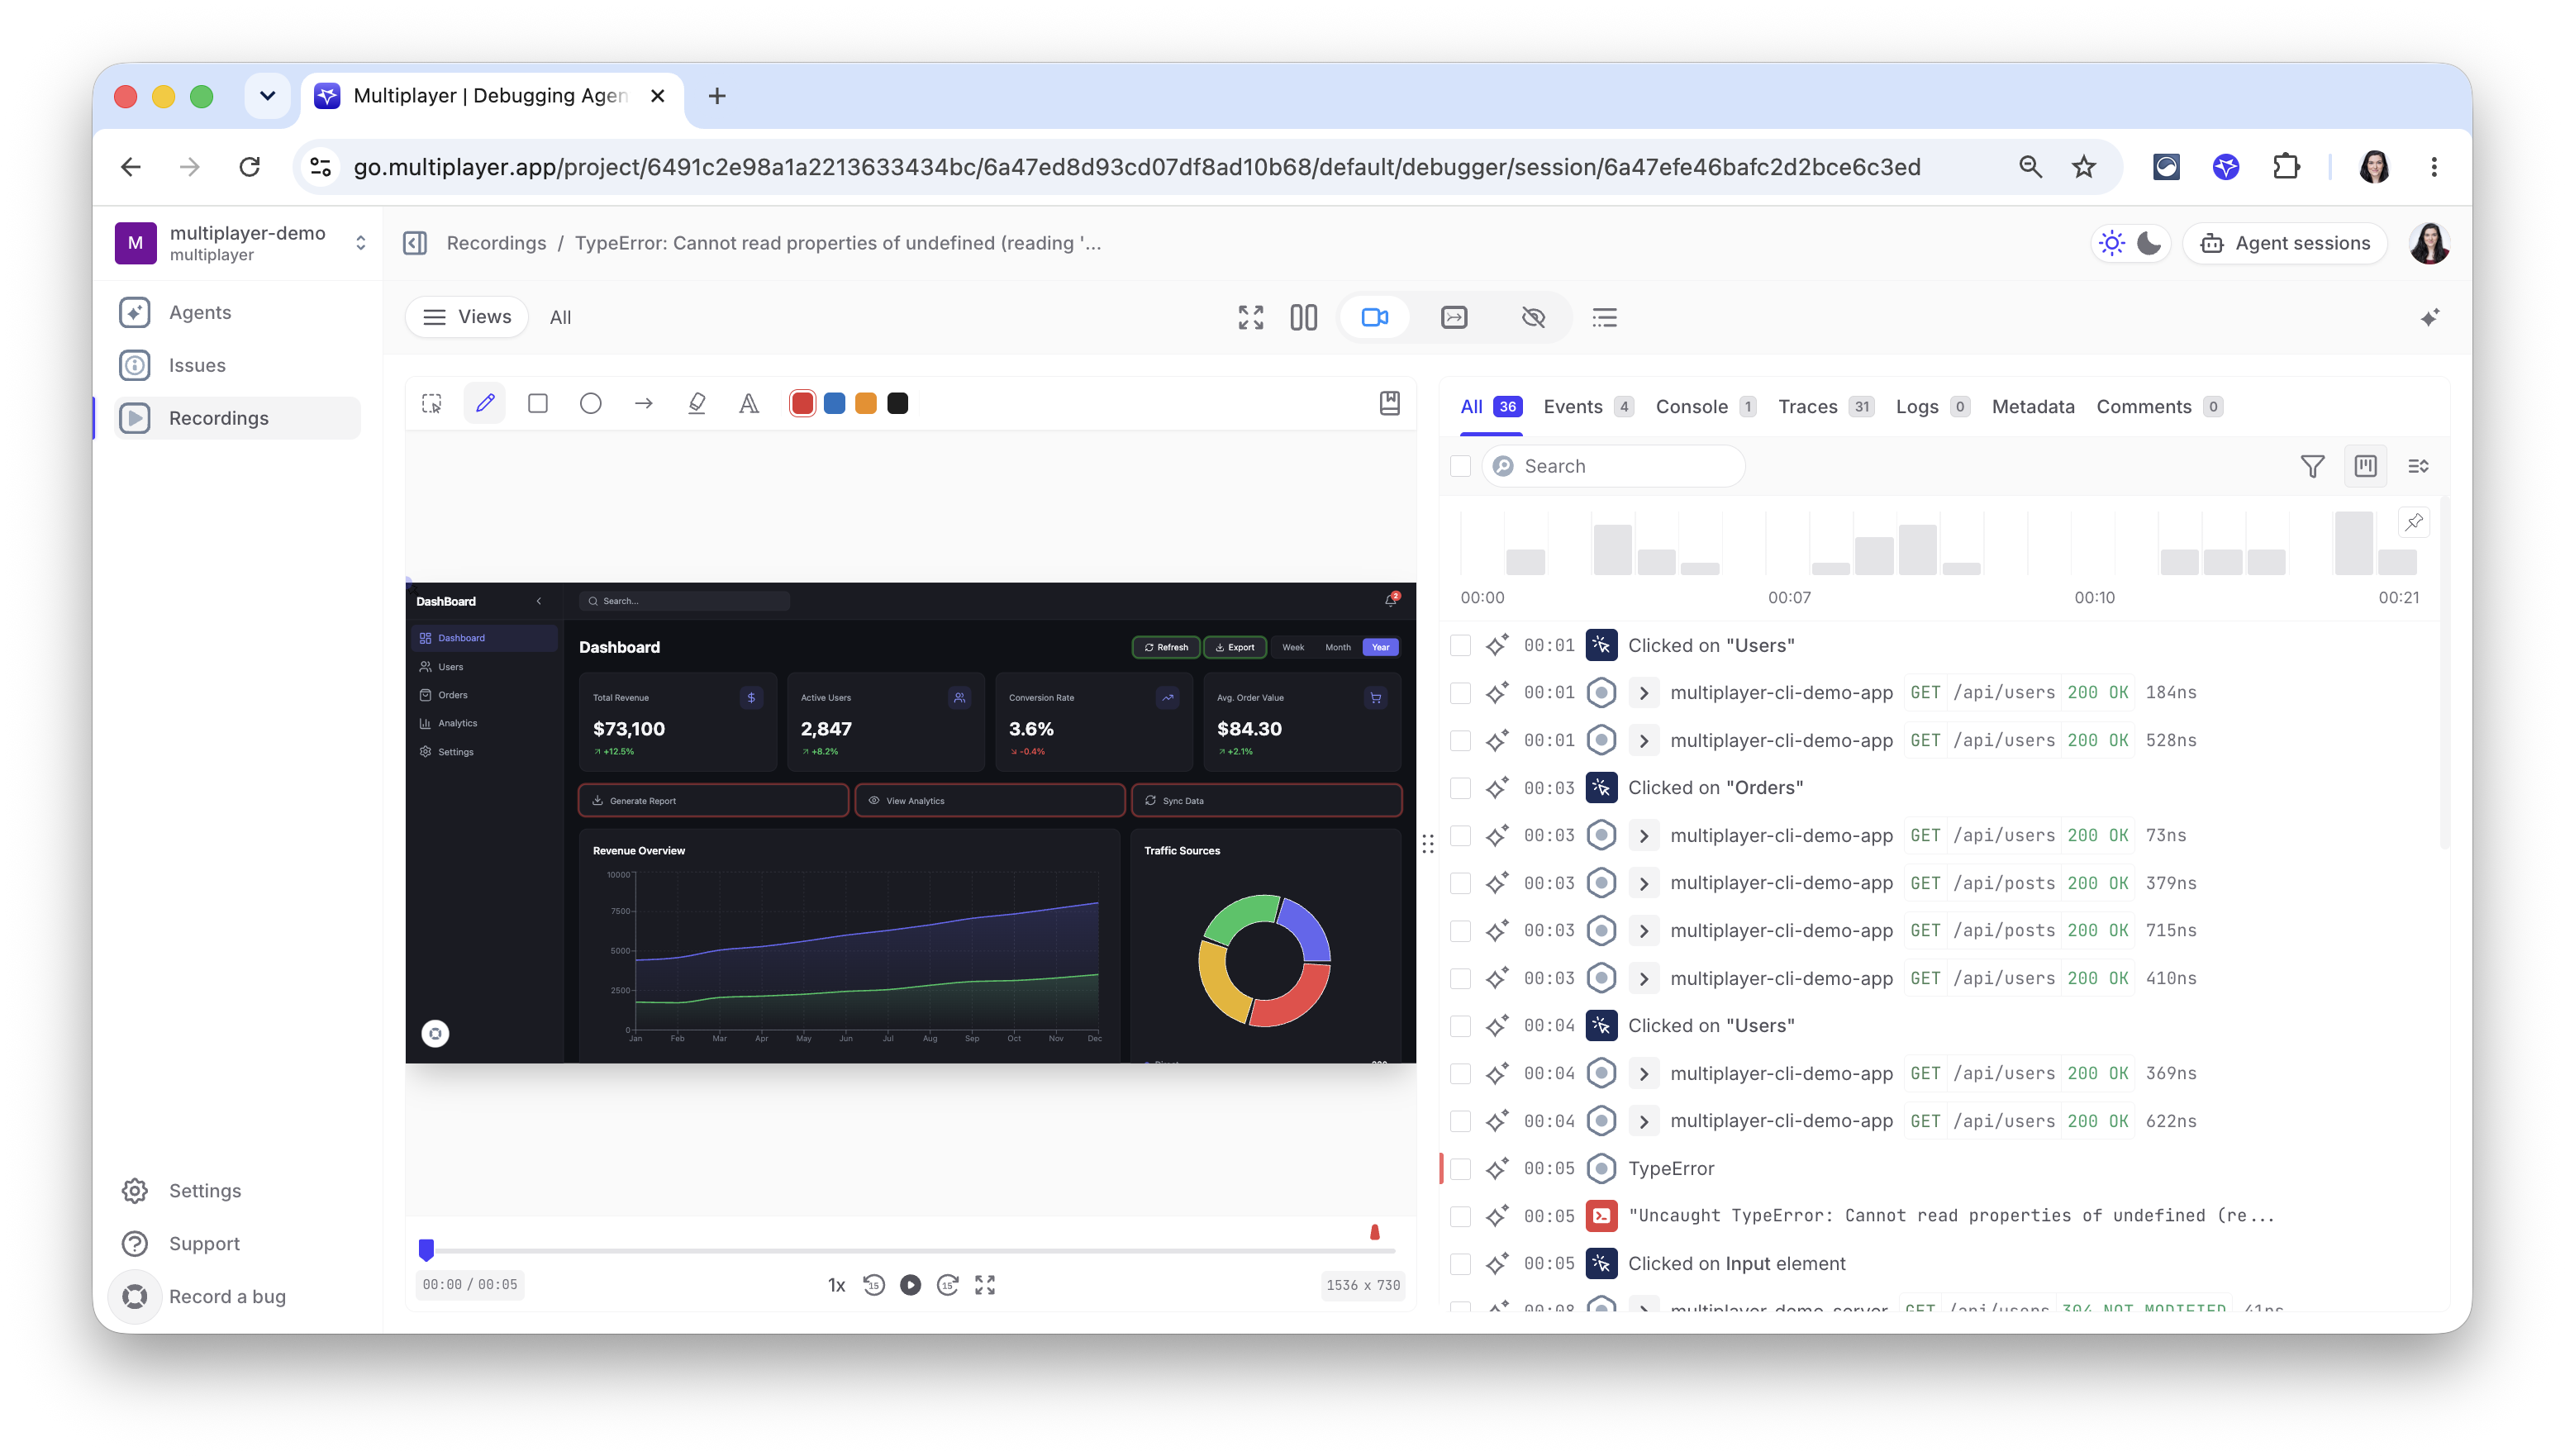
Clicking into a recording opens the replay synced to a timeline of every click, network request, console line, trace, and log. Draw on the replay or add a comment at a specific timestamp.
This is the same data your coding agent works from once the recording becomes an issue.
Start recording
Multiplayer is very versatile and offers multiple options for capturing session recordings:
- Install the debugging agent CLI
- Install the browser extension
- Install the JavaScript client library (including optional in-app widget)
- Install the React Native client library for mobile apps
🔑 Pro tip: Multiplayer is backend agnostic and supports OpenTelemetry: you can seamlessly integrated it with whichever observability stack you already use.
Recording modes
You can record session recordings in 3 modes:
→ Automatic: Automatically capture and resolve bugs in your application
→ On-demand: Manually start/stop recordings to capture bugs or unexpected behaviors
→ Continuous (rolling buffer): Manually enable/disable a rolling capture of your work. Recordings for errors and exceptions are auto-saved. You can also manually save recordings for your last 2 minutes of work
FAQs:
- How each recording mode works
- Which triggers create an auto-saved session recording in continuous mode.
- How to set up programatic triggers for session recordings
- What is the performance overhead for each recording mode
Data captured per recording
Multiplayer session recordings are full stack by default. After following all the quickstart you can expect this data automatically correlated per recording:
- Frontend data (e.g. user clicks + inputs, metadata, DOM events, console messages, etc.)
- Backend data (e.g. errors, traces, logs, request/response content and headers, etc.)
- Additional context (e.g. team annotations, user comments, etc.)
FAQs:
- What is all the data captured per recording
- How Multiplayer records and replays user interactions and data (Please note that Multiplayer is built with privacy in mind and, by default, all user inputs are masked.)
- How Multiplayer backend tracing works
Performance & overhead
Modern teams are rightly sensitive to anything that could slow users down. Multiplayer is designed for targeted issue capture without adding noticeable latency or chewing through bandwidth/CPU.
ℹ️ Please refer to this detailed explaination of how we do that and what controls you have: How Multiplayer stays lightweight
Recordings functionalities overview
These are the main functionalities in Recordings:
- Review recording to see the exact users / system behavior
- See auto-correlated full stack data for each recordings: everything that happened in your system from console events, to backend traces, logs, request/response and header content
- Annotate recordings with sketches and notes: turn session recordings into actionable development plans to share with your team or your AI coding assistant
- View the service and dependency map to understand which components, dependencies, etc. were involved
- Share insights with your team
Top navigation overview
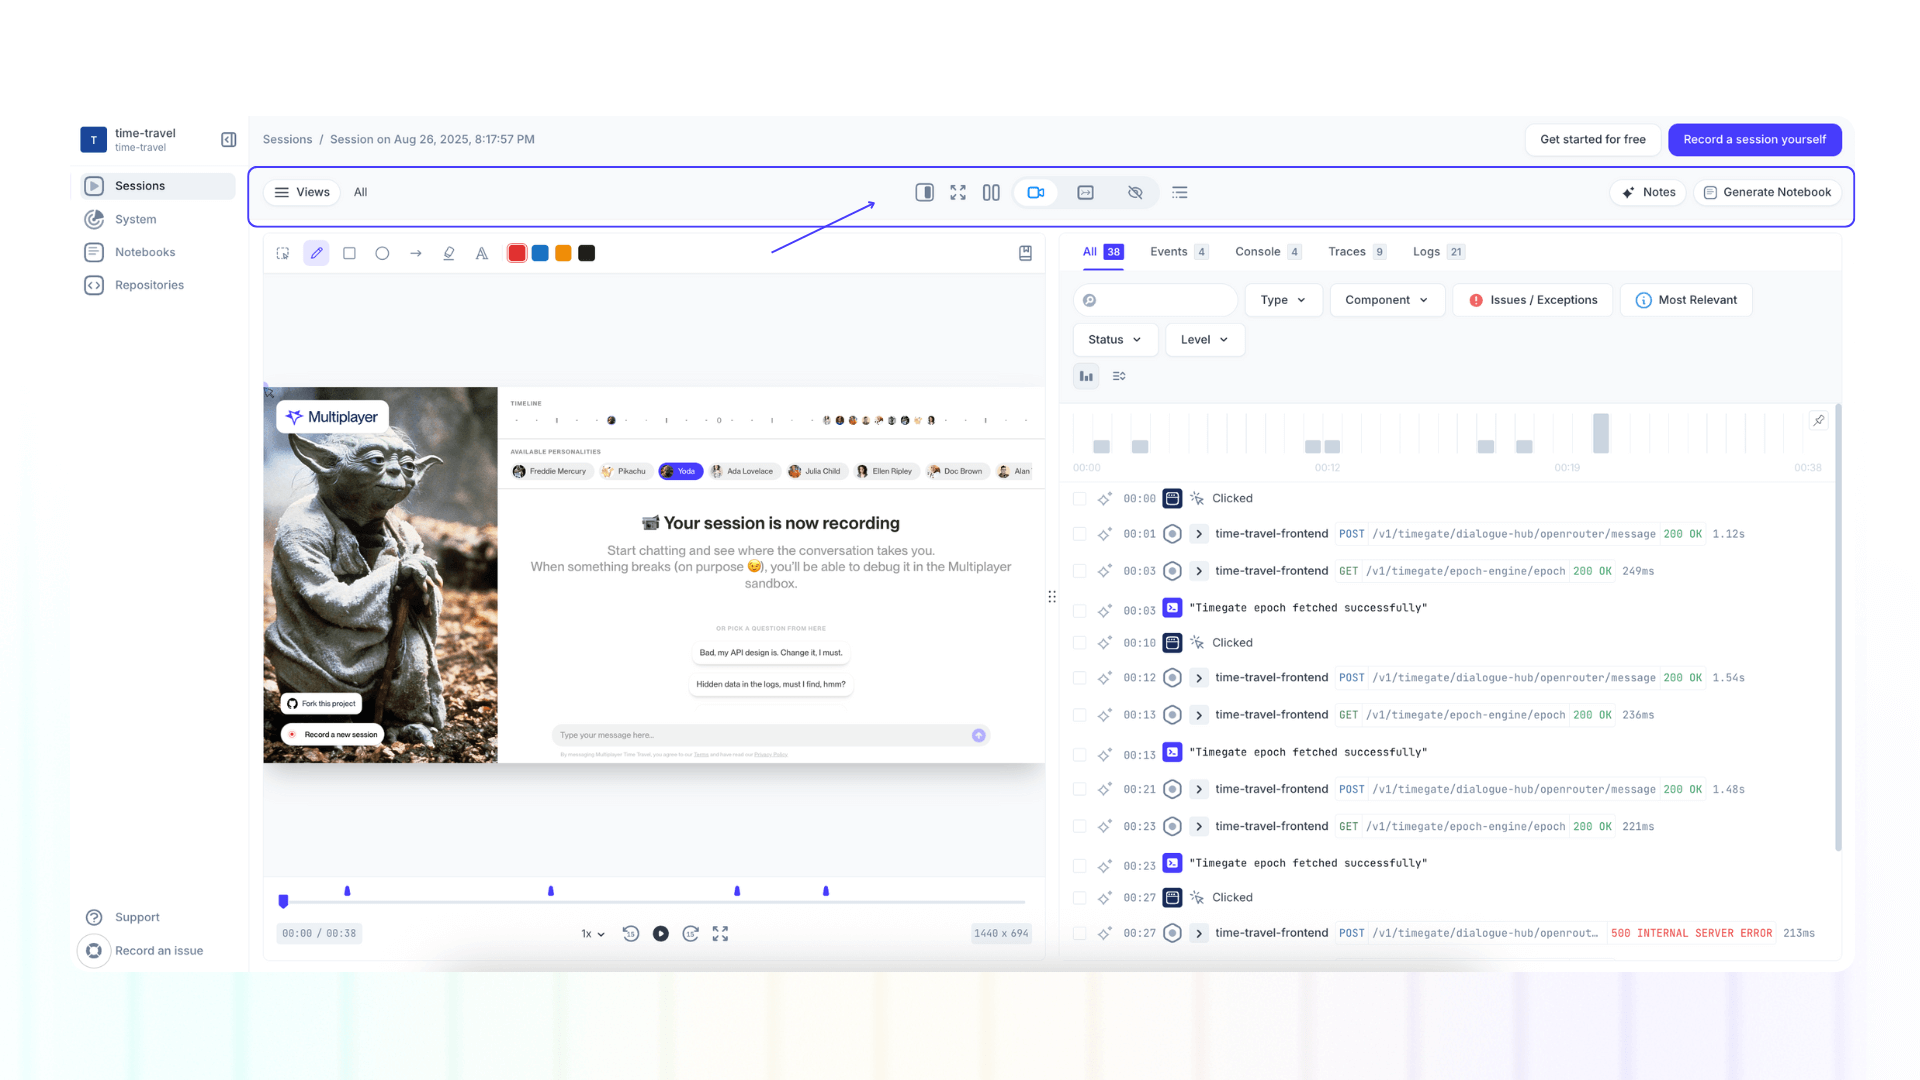
Left:
- Views: Per each session recording you can create filtered view(s) of events and data. Select specific events in the recording and click "Create a view".
Center:
- Open Recording Information: Opens the recording information panel to review and edit the recording metadata, user and team comments, device details, etc.
- Enter Fullscreen
- Switch to Vertical / Horizontal layout: Move the data panel to the bottom of the screen (switching from vertical to horizontal layout) for a better deep dive into events, console, traces, logs.
- Hide Data: Hide the data panel.
- Recording: Show/Hide the recording of the user steps / system behavior.
- Map: Show/Hide the service and dependency map to understand which components, dependencies, etc. were involved in the recording
- None: Show only the data panel and hide the recording or map panel
Right:
- Notes: Open the notes panel with the recording sketches, timestamp notes, or annotated frontend and backend data points
- Notebook: This will auto-generate a runnable test script in a notebook based on that specific session recording. This is an Enterprise feature. If you don't see it in your dashboard, contact our team.
Add sketches and notes on a recording
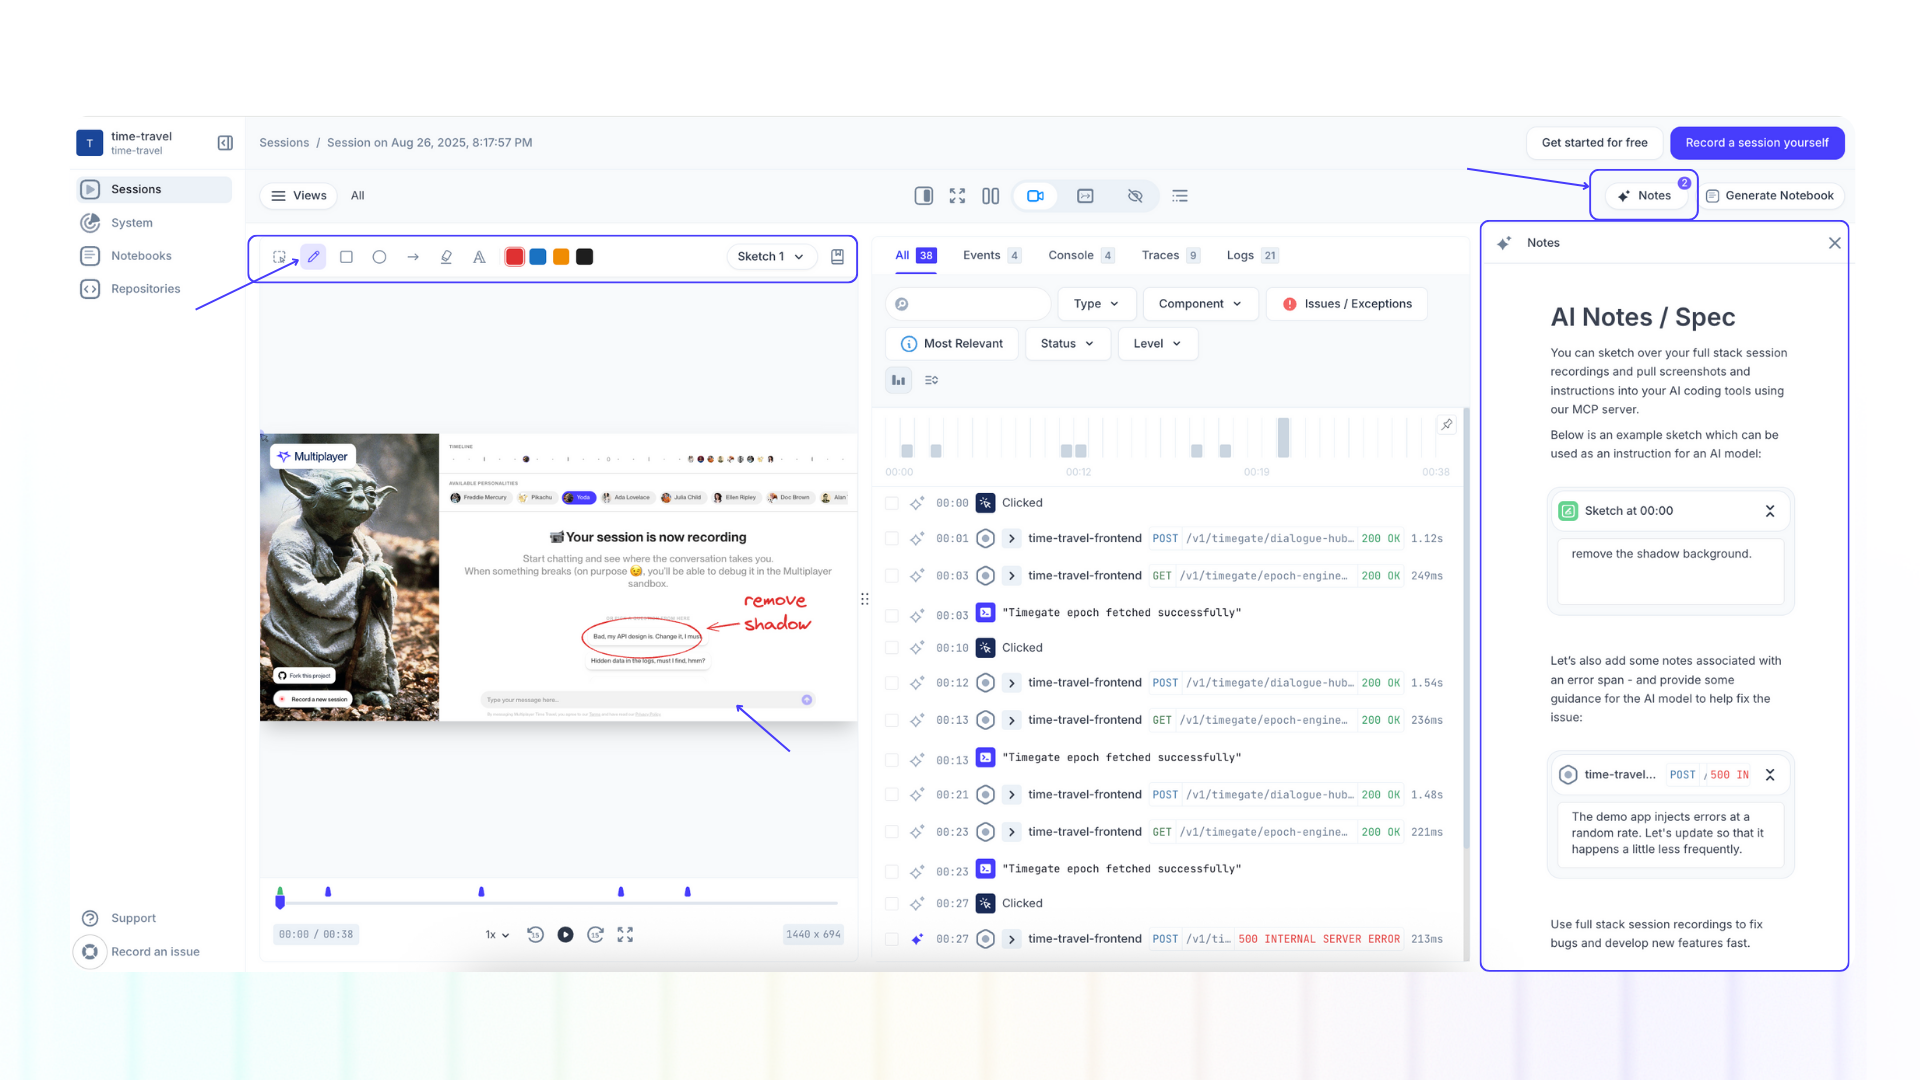
Annotations in Multiplayer let you turn raw session recordings into actionable development plans.
Whether you’re fixing a bug, clarifying requirements, or sketching a new feature idea, annotations help capture context directly on the timeline and make it reusable for your team or your AI IDE / AI coding assistant.
After you’ve recorded a recording, you can enrich it with additional context.
- Navigate to Recordings
- Open your recording
- Navigate to the desired timestamp
For each timestamp you can add multiple sketches, on-screen text, notes. You can also add annotations to traces, API calls, user interactions, etc. or just general, session-wide notes.
FAQs:
- Step-by-step guide to adding annotations to session recordings
- How to pull sketches and notes into an AI coding tool (NB. each annotation carries its own metadata, ensuring your context is precise, reproducible, and linked directly to the system events it relates to.)
Review and edit recordings information
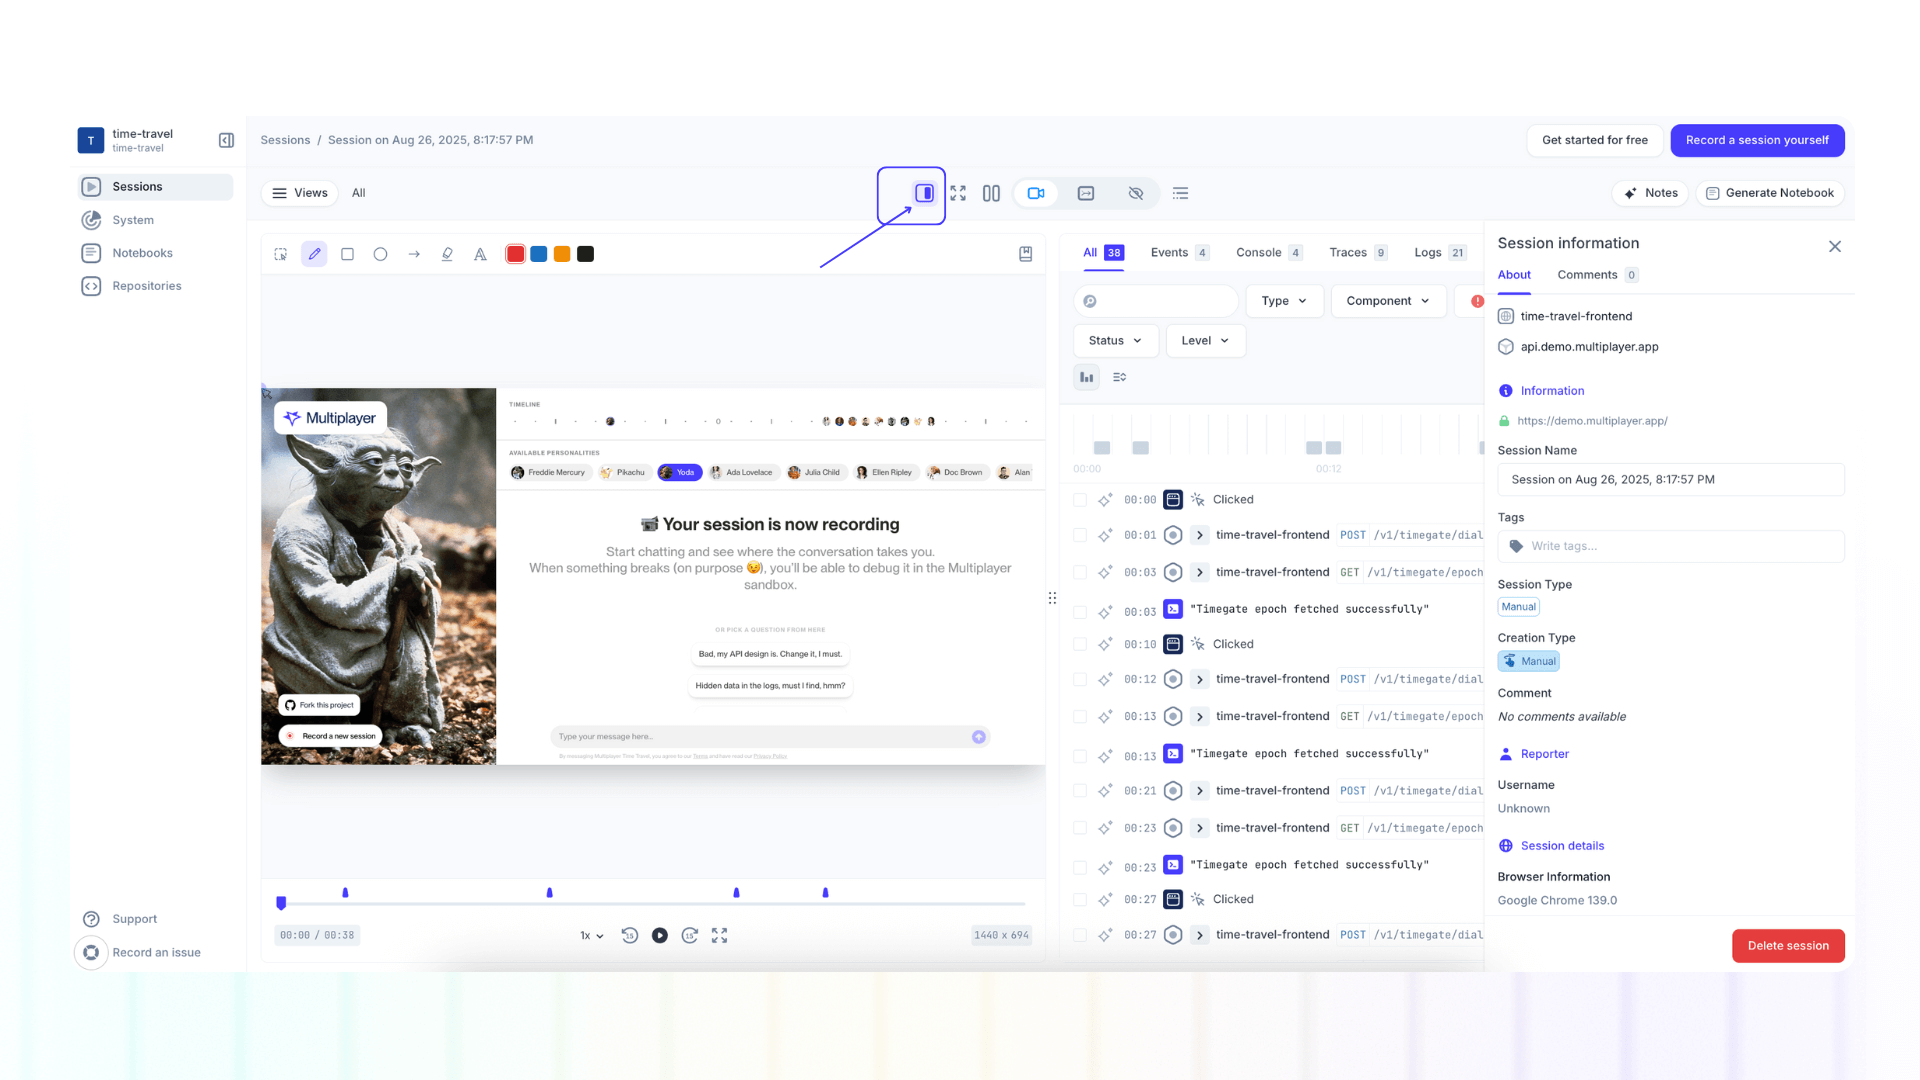
The Recording Information Panel has two tabs:
About - where you can:
- Edit the recording name
- Add tags to a recording (type the tag name and press enter)
- Review user comments (optional and available by default for all session recordings) and reporter username
- Review the recording details (browser, device, etc.)
- Delete a recording
Comments - where you can leave comments for your team.
Create custom views of events
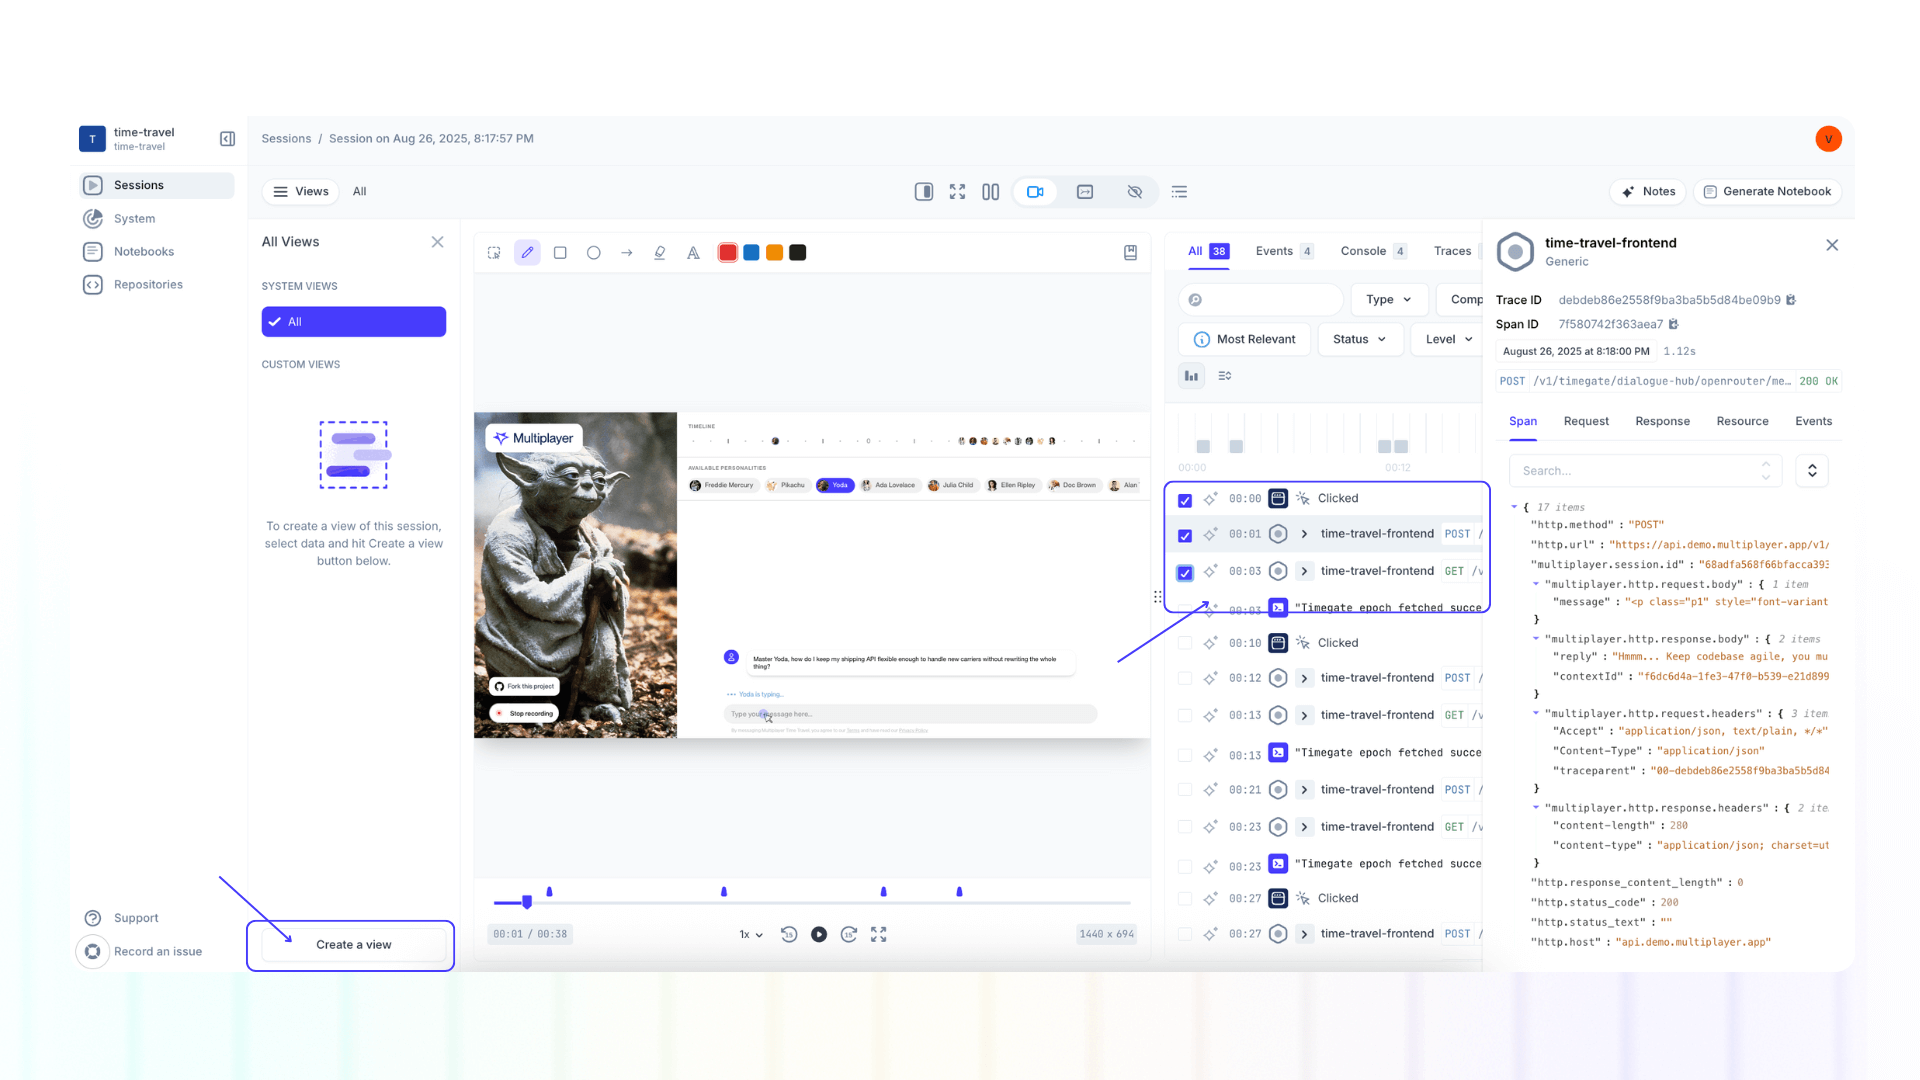
Within each recording you can create a custom view of a selection of events. Follow these steps:
- Open a recording
- Open the "Views" panel
- Select the events you want to group within a view
- Click "Create a view" in the "Views" panel
Filter / search recordings events
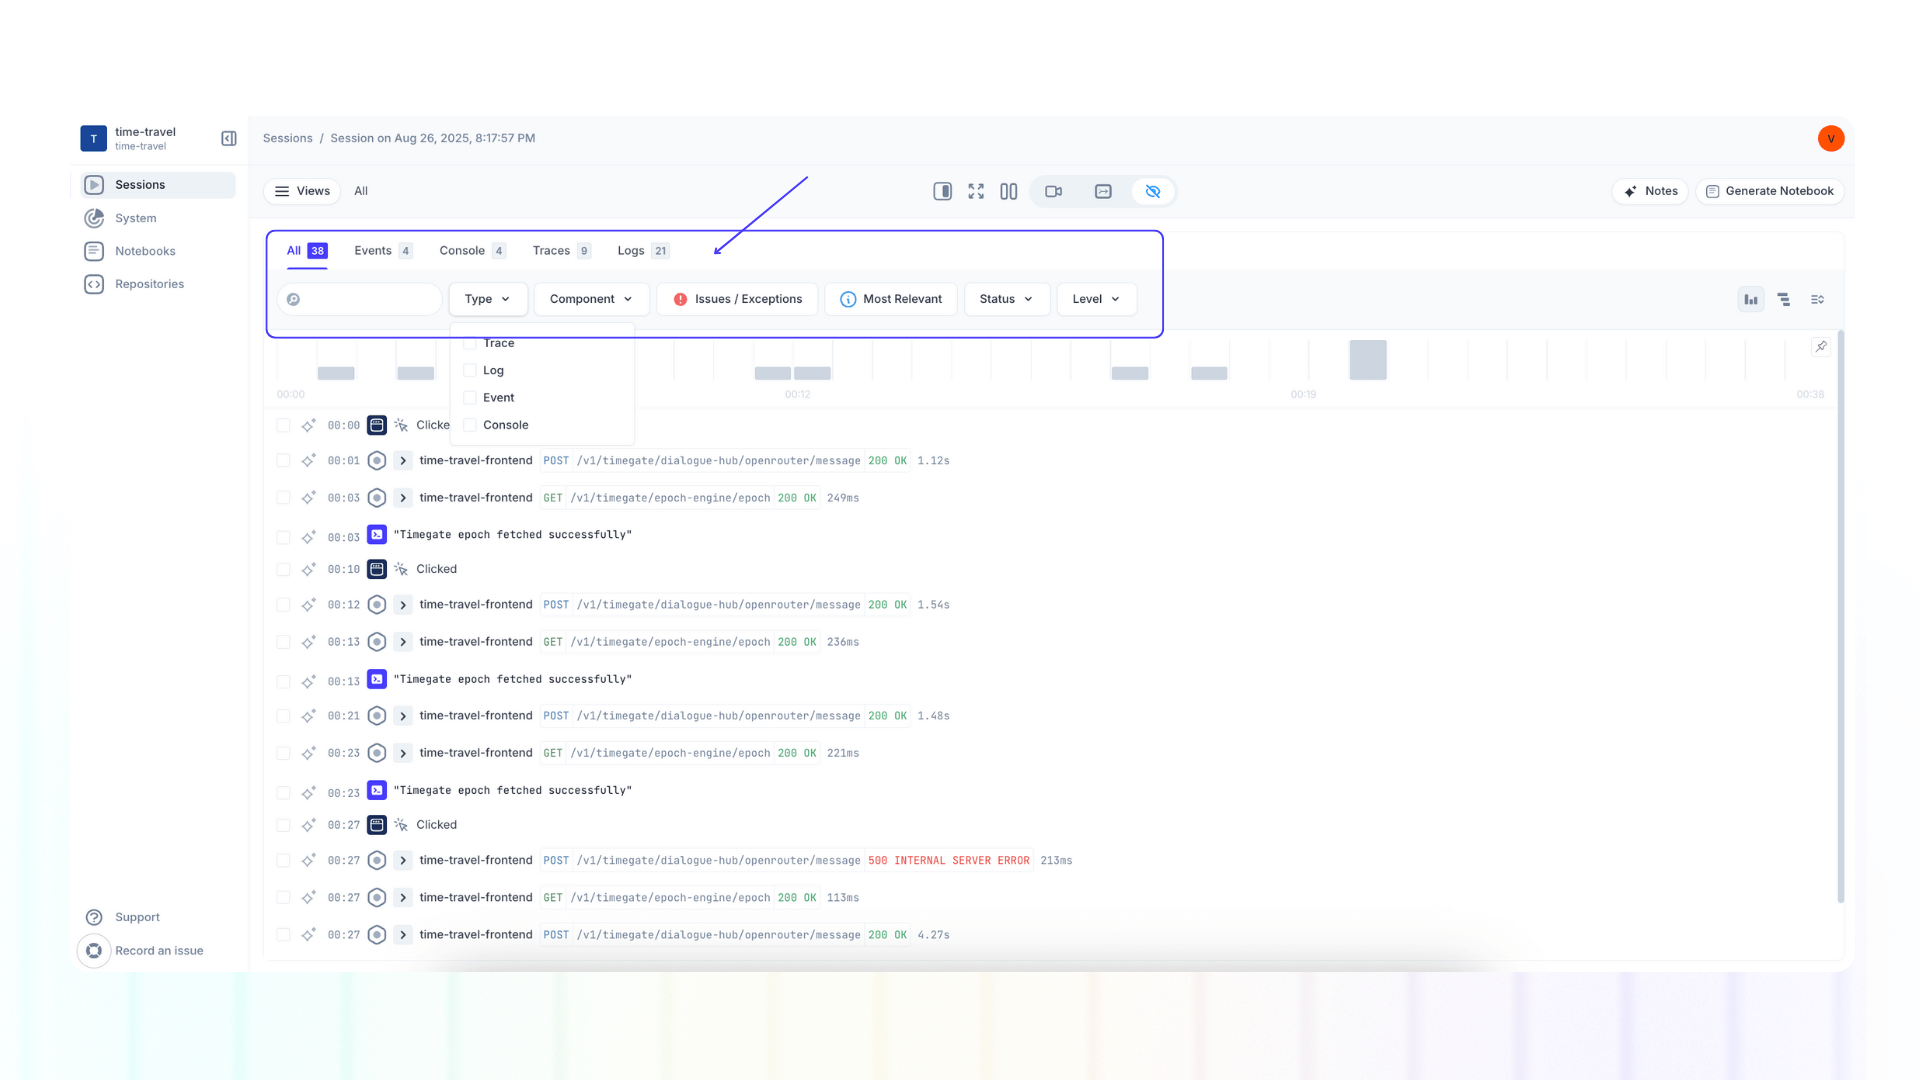
Events within session recording can be filtered by:
- Type (trace, log, event, console)
- Starred events
- Component
- Level (info, error, warn, debug)
Levels are assessed automatically. Here's an overview what each means:
- INFO: Indicates a general informational messages about the application’s state and workflow. Used for key checkpoints and expected operations.
- DEBUG: Indicates a detailed diagnostic information useful for developers when troubleshooting issues.
- WARN: Indicates a potential issue that is not currently breaking the application but may cause problems in the future.
- ERROR: Indicates a serious issue that could point to failures in execution, preventing normal operation.
View the service and dependency map
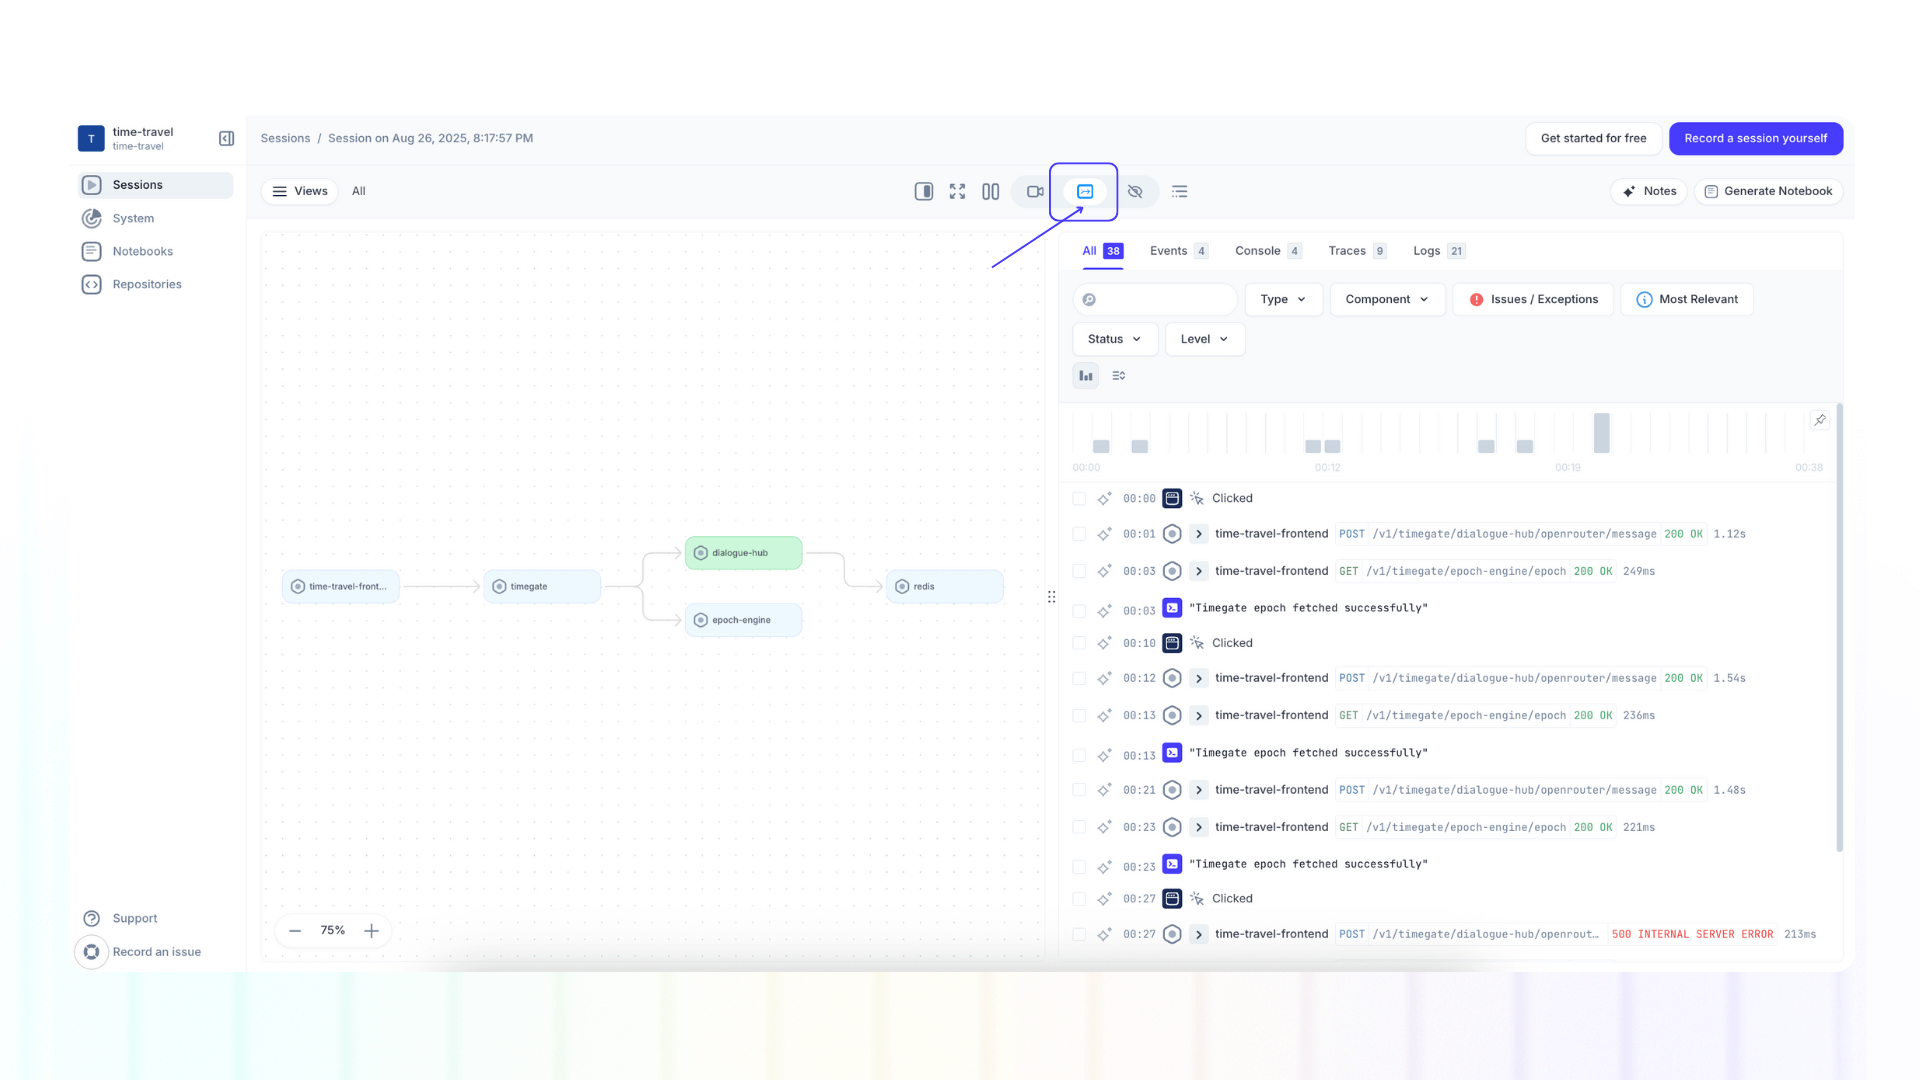
View the map of the system components and dependecies involved in a specific session recording.
System information is automatically detected and kept up-to-date when connecting your backend to Multiplayer.
Next steps
🚀 If you’re ready to trial Multiplayer with your own app, you can follow the steps in the quickstart.
📌 If you have any questions or want to report bugs please open a GitHub issue! 💜