Release Notes | 11 June 2025
📌 If you have any questions shoot us an email! 💜
We’ve been hard at work improving Multiplayer to make visualizing distributed systems better.
🌟 Help us spread the word about Multiplayer by sharing these updates on Bluesky, Threads, or X. 🌟
New Features
Automatically Create Test Scripts from a Full-Stack Session Recording
With full-stack session recordings, developers understand the “what”, “where” and “why” of a bug: they have all the critical context from frontend screens and backend data (logs, traces, metrics, etc.) to understand the root cause of the issue.
But that’s only half the equation: they now have to reproduce it and resolve it.
Multiplayer introduces today the ability to generate a notebook directly from a full-stack session replay of your bug, which auto-generates runnable test scripts - complete with real API calls, payloads, and code logic.
This bridges the gap between observation and action and allows developer to:
- Reproduce issues effortlessly: Notebooks capture the exact sequence of API calls, headers, edge-case logic, and system behavior that led to the bug, making it easy to simulate and understand the issue.
- Collaborate with full context: Share a complete, interactive snapshot of the bug. No more guessing, re-explaining, or syncing across tools — everyone immediately understands the problem and can test it themselves.
- Verify fixes immediately: Modify API or code blocks to test potential fixes. Re-run the notebook to confirm your patch resolves the bug before shipping. It acts like a unit or integration test, but targeted to the exact failure path.
- Document real behavior: Use notebooks to record how systems actually behave in production, including edge cases and unexpected flows. Great for onboarding, audits, or future reference.
- Prevent regressions: Re-run the notebook after code changes to ensure the bug stays fixed. It acts like a custom, high-fidelity regression test, built straight from the incident.

Generate Notebook Blocks with AI
This new feature 👆 expands the notebooks functionality providing developers with a testable, reproducible setup to simulate the bug and understand its scope.
However, one of the best ways to prevent bugs is to get it right from the start: that’s why we also improved the ability to design API integrations from scratch.
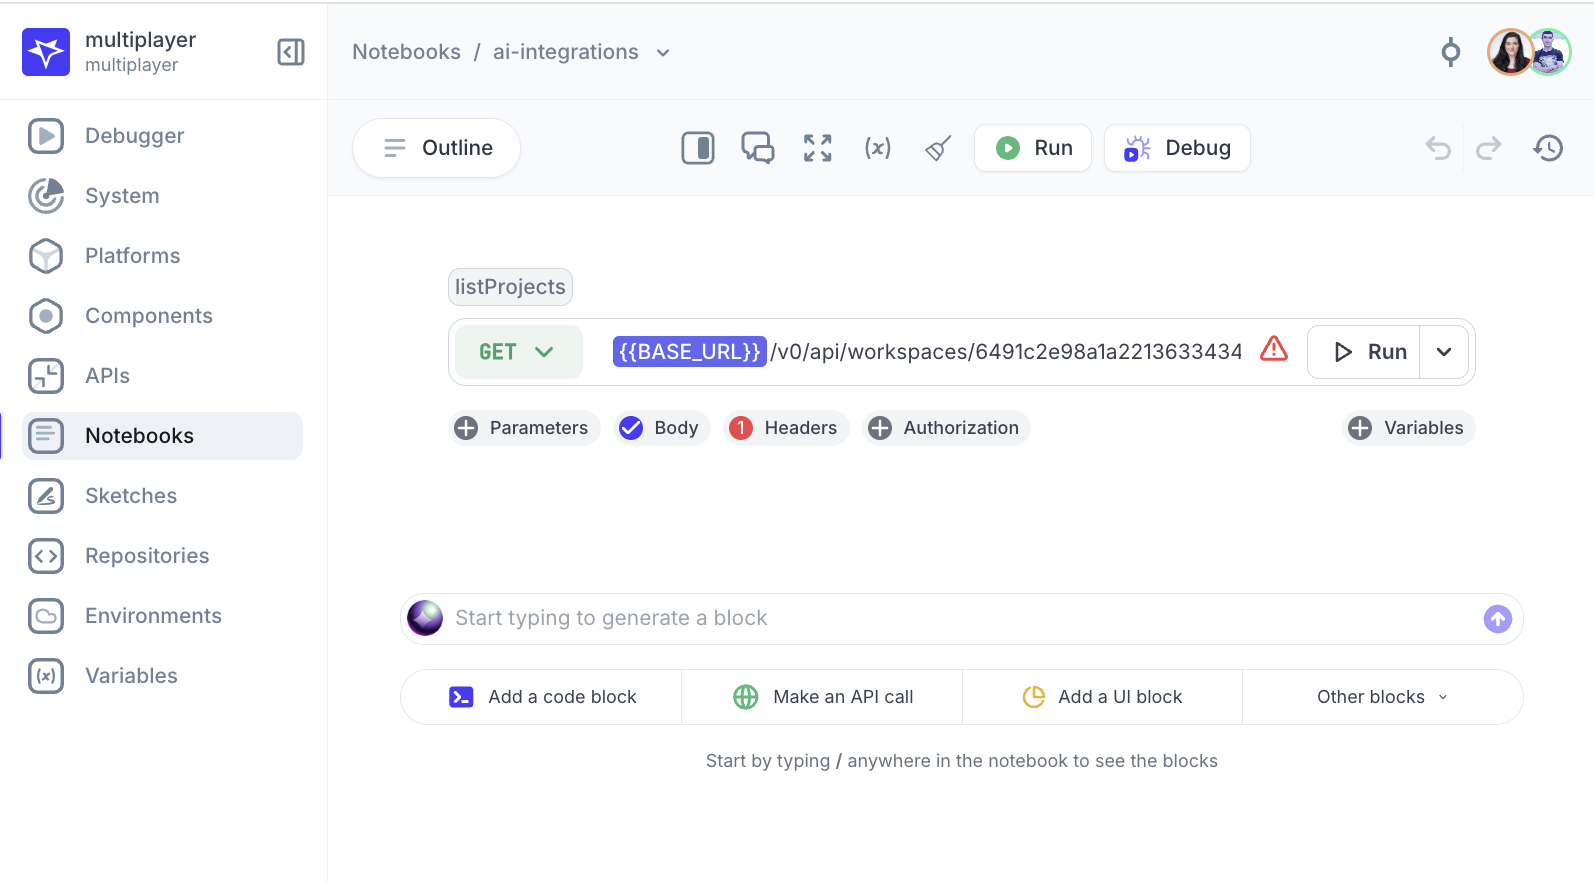
You can now use the AI field to easily create API, code, and visualization blocks.
When you’re creating a new API call block, describe what you want in natural language instead of manually copying from Swagger/OpenAPI docs or figuring out how to structure a request.
For example, you can just say: “Call the getUserDetails endpoint with a sample user ID”
And Multiplayer will auto-generate the right block, with the correct endpoint, payload structure, headers, etc., ready to run or edit.
Here’s a behind-the-scenes peek at how we ensure your API blocks have all the necessary context:
- When you add or update an API in Multiplayer, it gets broken down into small pieces ("chunks") — e.g., endpoints, methods, parameters, schemas.
- These chunks are stored in OpenSearch, which acts like a searchable index of all your APIs per project/workspace.
- When you ask the AI to generate a notebook block (e.g., "Call the order API with a sample order ID"):
- It runs a keyword search in OpenSearch to find the most relevant chunks (i.e., the closest matching API endpoints and schemas).
- These results become the context for the LLM (AI model).
- The LLM then uses that context to generate a valid API block for your Notebook, complete with method, path, headers, and body structure.
For other types of blocks (like code or text), the AI doesn’t get much context, but that will improve in future iterations.
Faster Debugging with the Multiplayer Browser extension
You can now start debugging sessions with Multiplayer directly from your browser, no widget integration required.
This new Chrome Extension makes it even easier to record frontend bugs and share deep session replays without changing your application code.
How it works:
- Install the extension from the Chrome Web Store.
- Log in to your Multiplayer account (new or existing).
- Enable debugging for the website you want to record.
- Select your workspace and project.
- Start recording a bug (session data will be tied to a single tab and domain).
⚠️ Some websites may block script injection or restrict CORS access. If you run into issues, contact support.

This is ideal for:
- Teams who want to debug staging or production environments without adding the Multiplayer widget.
- QA, PMs, and engineers capturing frontend bugs in real-time.
- Faster bug reporting from your users, without changing your codebase.
Try it now and streamline your debugging workflow. No setup friction. Just hit record.
Improvements
We’ve cleaned up and simplified the UI for easier navigation:
- Removed tabs: new entities open directly on the screen
- Minimized "design branches" to an icon in the top right corner, next to your profile icon
- Added a drop down menu to switch between entities within a section (e.g. notebooks)
📌 If you’re interested in a particular feature send us a note - this will help us prioritize what you need the most!