Welcome
👋 Welcome to Multiplayer!
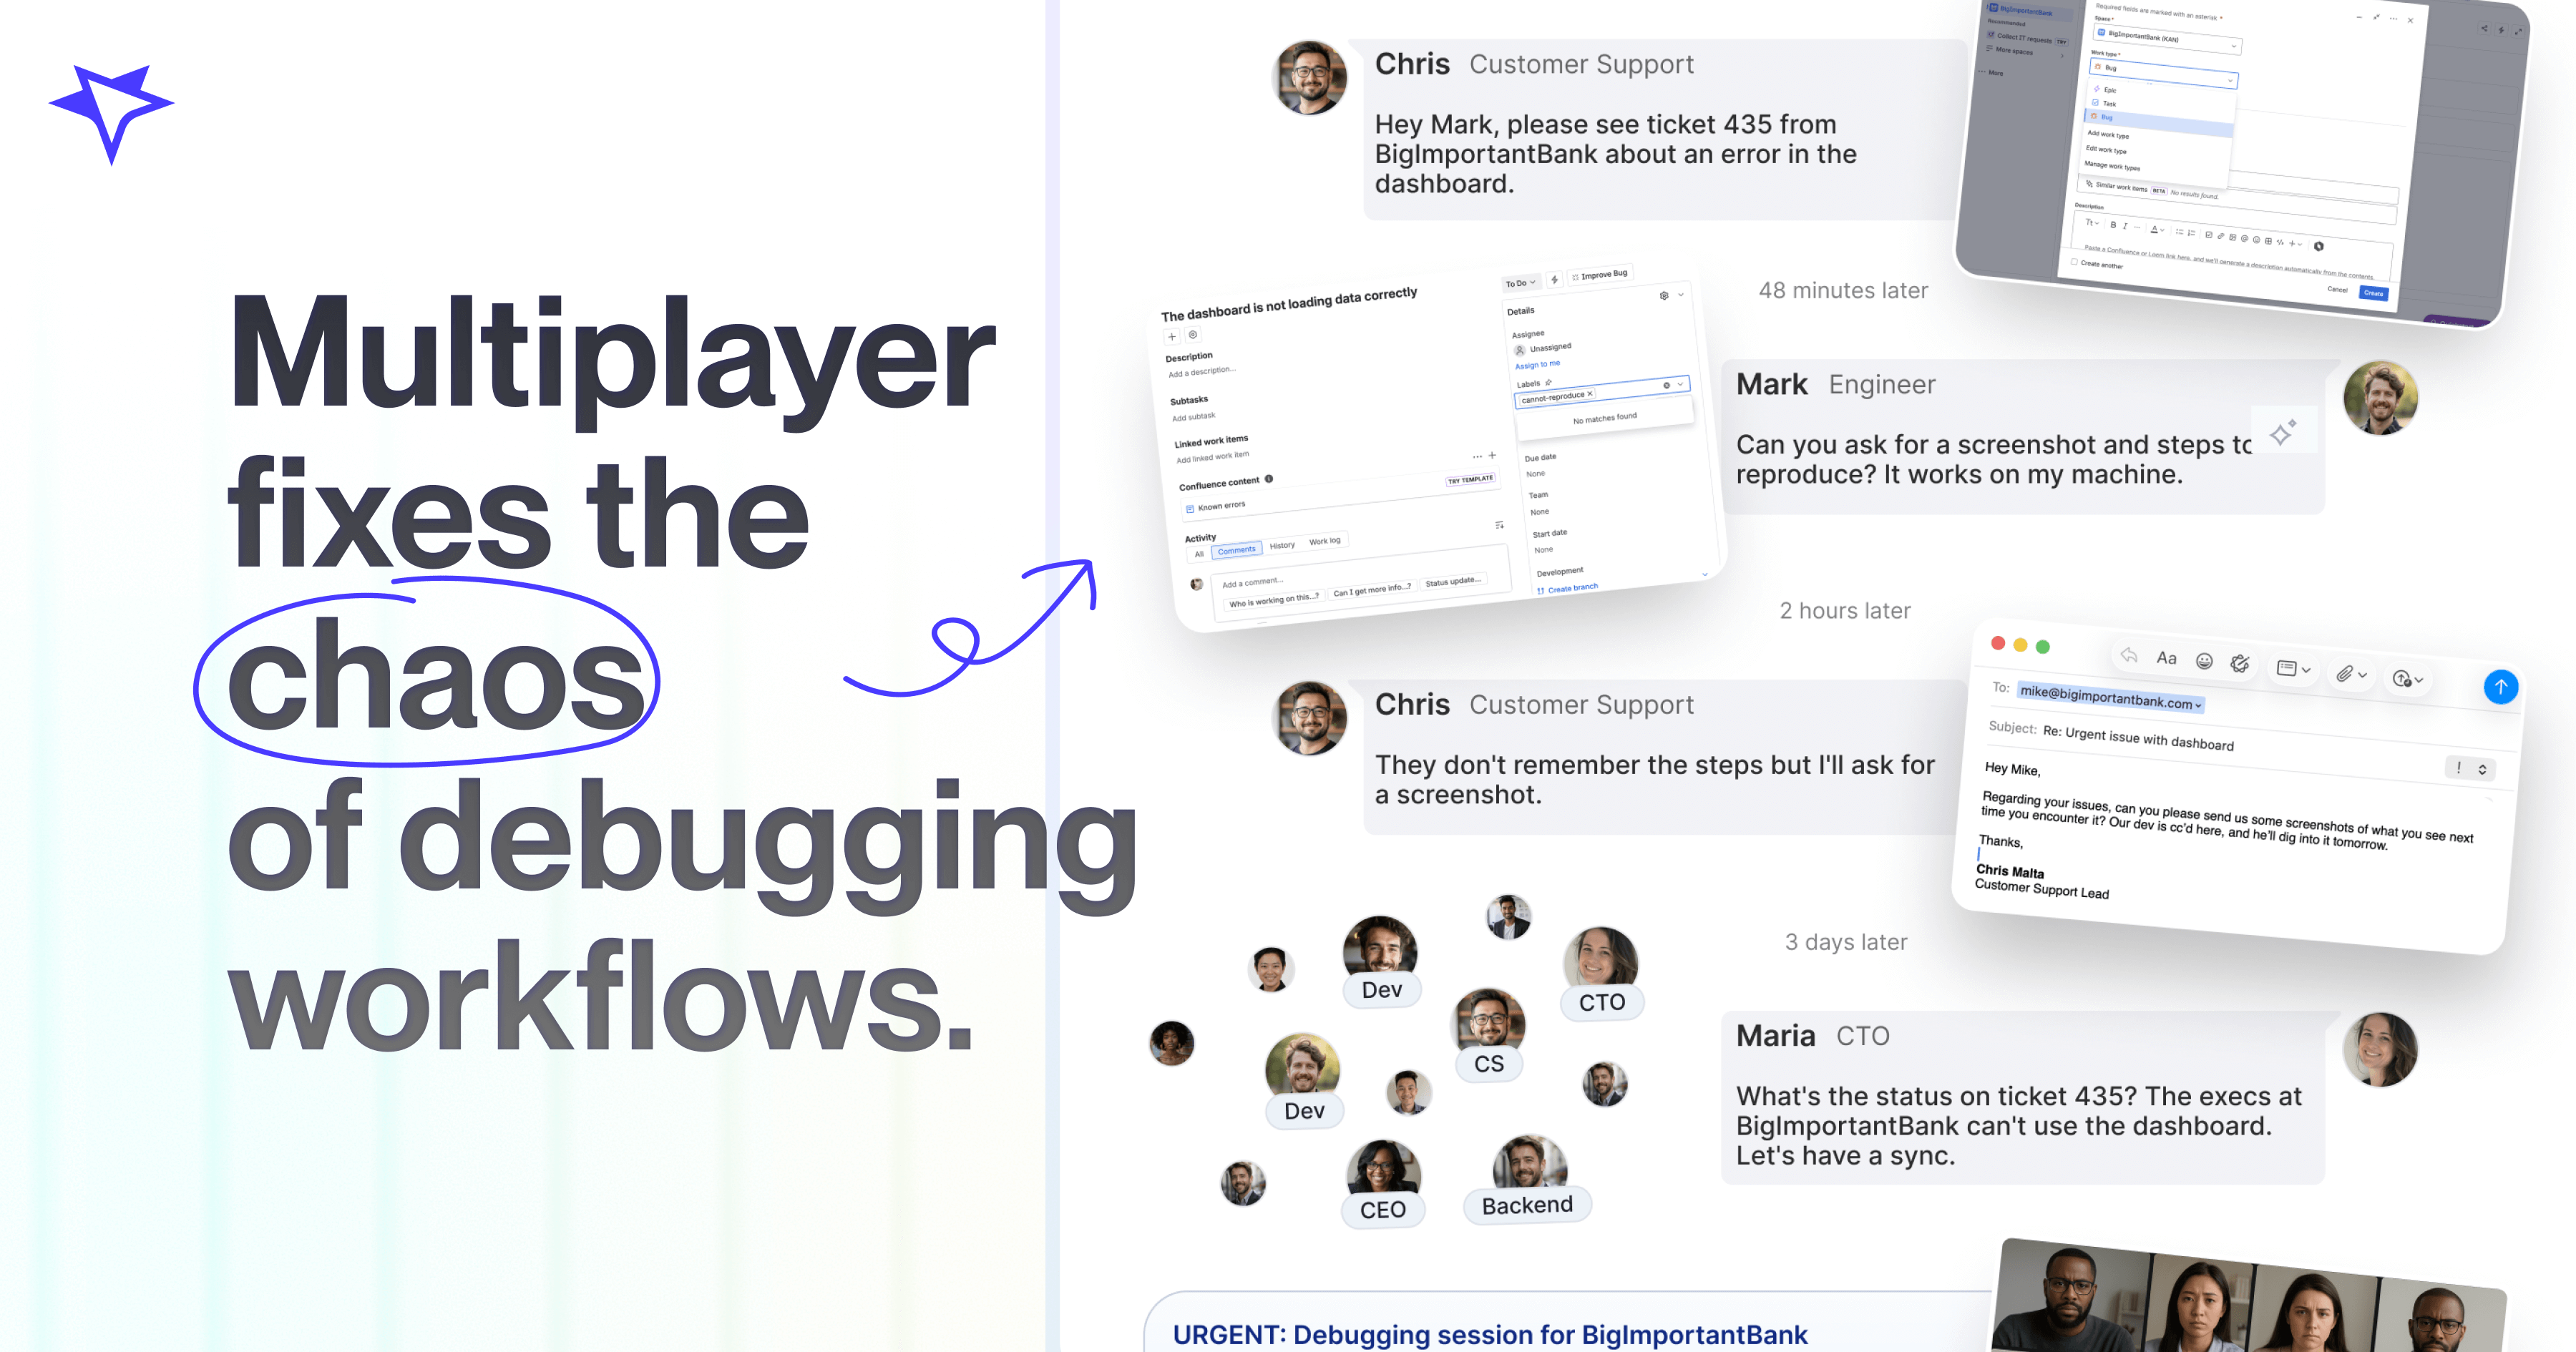
With Multiplayer full stack session recordings, support teams get visibility, developers get context, and users get fixes. All from a single, collaborative session replay.
Full stack session recordings capture the complete picture: frontend, backend, and everything in between. Each recording is:
- Purpose-built for debugging with full-stack, end-to-end data. From user actions and feedback to backend traces and logs, including details most tools miss (like request/response content and headers from middleware and internal service calls).
- Suitable for any support workflow. Multiple full stack recording modes give you control without overhead. Multiple installation methods work however your team works. Your team can work across multiple use cases: from actively resolving technical support tickets to proactively identifying bugs so you can fix them before users even realize they are there.
- Designed for support and engineering collaboration. View, share, and annotate every aspect and data point of a session recording or use notebooks to auto-generate runnable test scripts, test complex API integrations, collaborate on feature requirements or visualize data sets.
- Developer-friendly and AI-native. Full-stack session recordings are compatible with any observability platform, language, environment, architecture, and IDE / AI tool. You can also host in the cloud or self-host.
Explore Multiplayer
-
go.multiplayer.app: Free 30-day trial + free (forever) plan. Follow the configuration steps to get started.
-
sandbox.multiplayer.app: See full stack session recordings in action. Or check our "Time Travel" demo app and record a full stack session replay that appears instantly in the sandbox.
-
fork the demo app repo and experiment locally: If you're not ready to configure Multiplayer with your own application, this is a great way to understand how Multiplayer integrates into a real application, while still in a controlled environment.
ℹ️ Multiplayer is versatile by design, with multiple ways to customize how you capture session replays and how much detail gets recorded automatically. In this choose-your-own-adventure setup, most teams are fully configured in just a few hours and can get started the same day.
If it’s taking longer or you hit a blocker contact us.
What’s next?
- Book a call with us today. Get up and running tomorrow.
- If you have any questions shoot us an email
TL;DR
| Overview | |
|---|---|
| Application type | Web & Mobile |
| Deployment | SaaS & self-hosted |
| Installation | Browser extension, in-app widget, SDK / CLI apps |
| Recording modes | On-demand, Continuous, Conditional |
| Data captured | Full stack (including unsampled traces, full request / response payloads from service to service, user feedback, etc.) |
| Collaboration | Annotations of individual session data points, sketches, comments, sharing, notebooks |
| Security | User inputs are masked by default, with customization options for frontend and backend data masking |
| AI support | Session data is AI-ready + MCP server support for VS Code, Cursor, Copilot, Claude Code, Windsurf, Zed |
| Browser extension | Chrome, Firefox, Edge |
| In-app widget [web apps] | JavaScript client library (framework-agnostic) (specific examples: React & Next.js, Angular, Vue.js) |
| In-app widget [mobile apps] | React Native client library |
| CLI apps / SDKs | Node.js, Python, Java, .NET, Go, Ruby |
| Issues captured | Any. Frequent or not. Vague user reports, to complex bugs including hard-to-reproduce, intermittent issues |