Guide
Software Architecture Diagram Example & Tutorial
Table of Contents
Software architecture diagrams capture the components and interactions taking place within technical systems. They present aspects of the system in a visual way, showing the boundaries between layers and resources and how data and processes flow through the system.
This article examines the fundamentals of software architecture diagrams. We explore the core types of diagrams and offer advice and best practices for how to create them effectively through examples.
Summary of software architecture diagram concepts
| Concepts | Summary |
|---|---|
| What is a software architecture diagram? | A software architecture diagram represents a system’s structure and is crucial to understanding, planning, and executing software projects. |
| Types of software architecture diagrams | System architecture, sequence, and network diagrams document and provide insights into different aspects of a system, such as system design, application workflows, and the interplay between network nodes. |
| Benefits of software architecture diagrams | These diagrams are vital for clear communication, identifying and resolving problems, supporting decision-making, and enhancing documentation and knowledge transfer. |
| System architecture diagrams | System architecture diagrams typically include modules/components, connections/relationships, interfaces, data flows, layers, external systems, and annotations/descriptions. |
| Sequence diagrams | Key elements in sequence diagrams include actors, lifelines, activation bars, messages, return messages, and event sequences. They focus on functionality and processes over time rather than on the system elements themselves. |
| Network diagrams | Network diagrams include nodes, connections, network devices, subnets, and external interfaces. Accuracy in these diagrams is crucial for understanding network infrastructure, especially regarding security and scalability. |
| How to create software architecture diagrams | Creating impactful diagrams involves understanding the technology, presenting clearly, and using suitable tools. The process also involves understanding the system, selecting the diagram type, focusing on essential elements, refining with feedback, and documenting. |
What is a software architecture diagram?
A software architecture diagram acts as a visual guide to a software system’s structure. It graphically represents the system’s components and how those components interact. In doing so, it provides crucial documentation to help understand, plan, and execute software development projects. By facilitating communication between developers and stakeholders, effective diagrams catalyze the development process.
Types of software architecture diagrams
There are many varieties of software architecture diagrams, each serving a specific purpose and offering unique insights. Here, we focus on three of the most important types:
- System architecture diagrams: These diagrams provide a comprehensive view of the entire system’s architecture. They show how different components—like databases, servers, and user interfaces—fit together and interact. Ideal for providing a high-level understanding, they help stakeholders grasp the overall structure and design of the system.
- Sequence diagrams: These diagrams focus on the chronological interaction among components, showing the order of operations, events, or messages that occur throughout a series of steps in the system. They are particularly useful in understanding dynamic processes and workflows.
- Network diagrams: These diagrams concentrate on the physical or logical arrangement of the system’s network. They illustrate how network nodes (like servers, routers, and clients) are interconnected, and they provide key intel for troubleshooting, network design, and security analysis.
Understanding when to use each diagram and the strengths and weaknesses of each is crucial to creating effective documentation of complex system details.
Benefits of software architecture diagrams
Software architecture diagrams provide numerous benefits in the software development process, including:
- Clear communication: They act as a bridge among various project participants, including both technical and non-technical members.
- Problem identification and resolution: They help teams spot potential structural or design issues early on by visualizing component relationships.
- Supporting decision-making: They provide a comprehensive view of the system to inform decision-making, especially in complex, multi-faceted projects.
- Enhancing documentation and knowledge transfer: Software architecture diagrams are valuable tools for new team members or external collaborators, helping them quickly grasp the system’s workings.
Example system architecture diagram


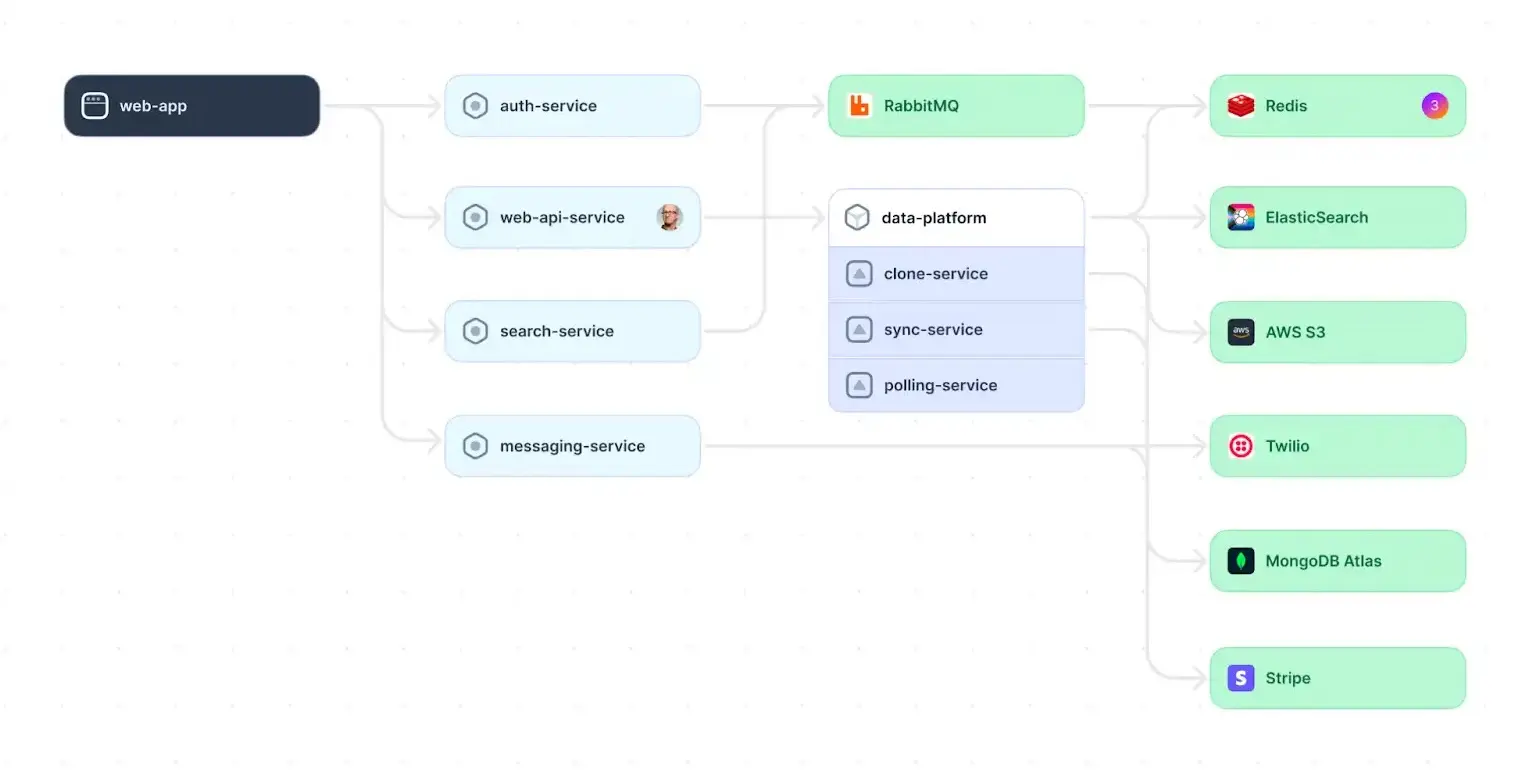
In this example of a system architecture diagram, we see a user interface (represented by the “web-app” component), a service layer, a data layer, and external services (such as Redis, ElasticSearch, and AWS S3) defined. Each layer appears as a column with individual layer components stacked vertically and interconnected with other layers by flow lines.
Grouping resources in columns like this or through the use of color (like the “data-platform” component) highlights common elements and adds a common visual structure to the resources inside.
Full-stack session recording
Learn more


Essential components of a system architecture diagram
- Modules or components: These are the main functional units, such as databases, servers, clients, and external APIs.
- Connections/relationships: Illustrated as lines or arrows, these elements show how units interact and rely on each other.
- Interfaces: These are points of interaction within the system, like APIs or data endpoints.
- Data flow: This is the trajectory of data within the system, often marked by directional arrows.
- Layers: These represent different system levels, including presentation, business logic, and data storage.
- External systems: These are systems outside the diagram that still interact with it, such as third-party services.
- Annotations/descriptions: These provide extra details about the system’s components and their connections.
Potential pitfalls
Overcomplication of a system architecture diagram leads to confusion, but oversimplification leads to misinterpretations of the system’s functionality. Failure to update diagrams over time causes similar confusion and misrepresentation of the system’s workings.
Avoiding these pitfalls becomes easier with practice. You must find a balance between complexity and clarity in your diagram, understand your audience, and include the right amount of detail in your diagram, without clutter, to convey details of the system architecture. In addition, be sure to make periodic updates to the diagram as new features are added to keep it relevant.
Example sequence diagram


Sequence diagrams aim to map out how different system elements interact over time. They are more functional in nature than other diagram types, focusing on the actions, steps, and processes happening to elements in sequence over time and less on the elements themselves.
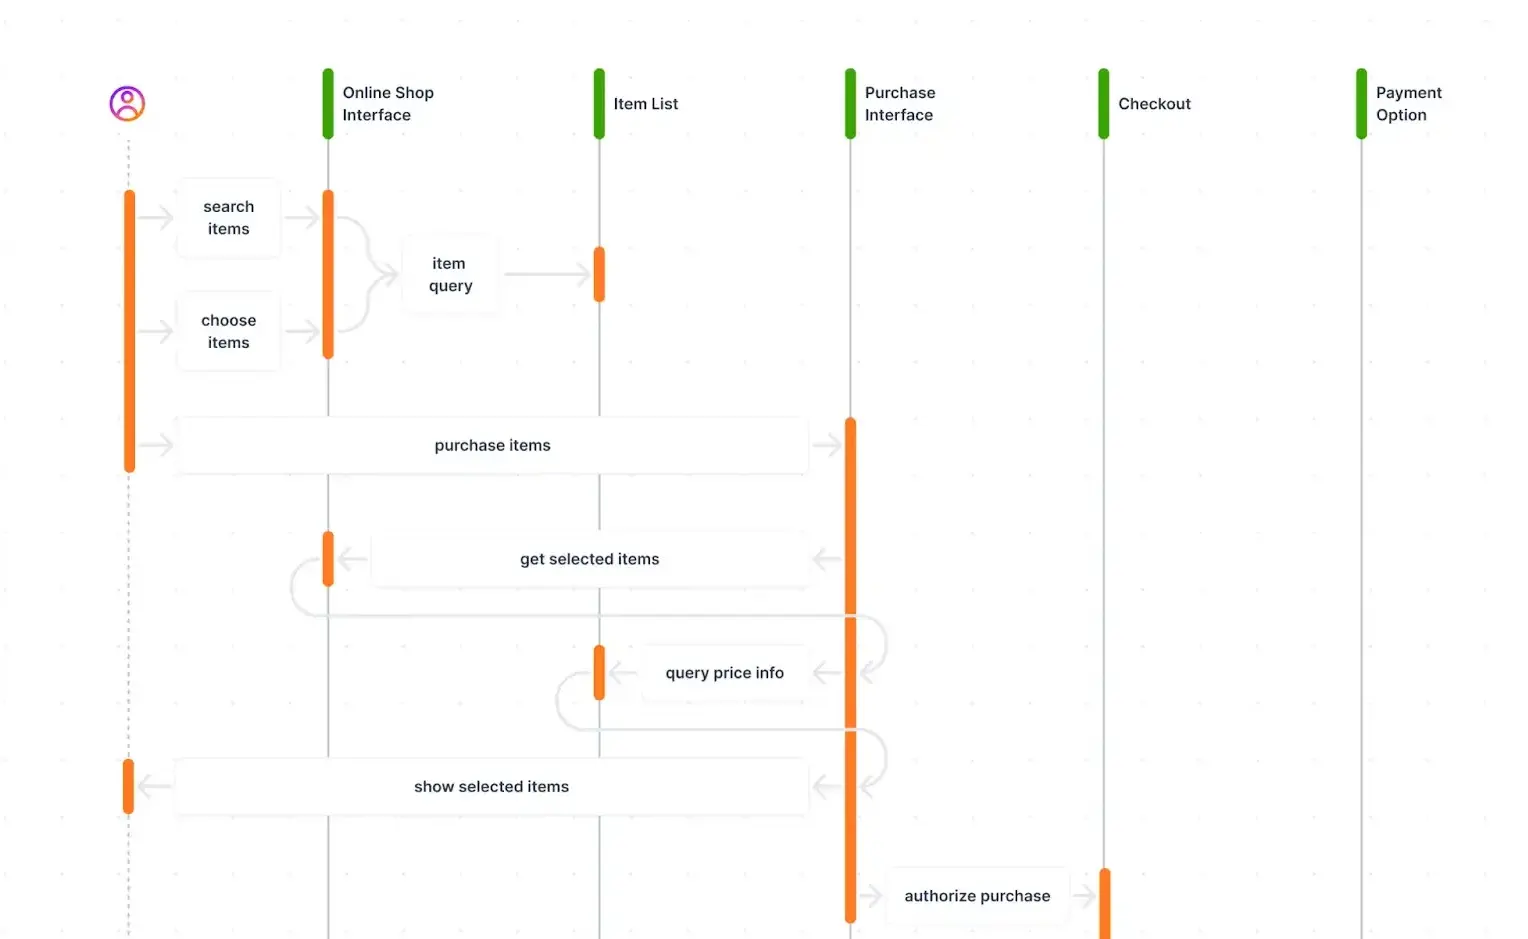
This sequence diagram example shows an online store’s order placement process. The diagram shows the series of steps a user takes on the journey to purchase a product.
We see a UI workflow where a user searches for, selects, and purchases an item from an online store. The vertical dashed lines show the interfaces between steps in the process. Events flow left to right in sequence and sometimes back again as data returns from one step to the previous step.
Essential elements of a sequence diagram
- Actors: These are the system users or external parties (represented by the stick figure in the diagram above).
- Lifelines: These are vertical lines indicating an object’s lifespan.
- Activation bars: These bars show when an object is active or in use (yellow bars).
- Messages: The arrows connecting lifelines symbolize communication, like method or function calls.
- Return messages: Typically dashed arrows, these show responses or returned data.
Interact with full-stack session recordings to appreciate how they can help with debugging
EXPLORE THE SANDBOX(NO FORMS)
Potential pitfalls
Common issues with sequence diagrams include the following:
- Ambiguity: Unclear event sequencing can lead to confusion.
- Missing scenarios: Not showing alternative paths or exceptions reduces the usefulness of these diagrams.
- Complexity: Overly complicated diagrams are hard to follow for those not deeply familiar with the system.
Sequence diagrams fail in many of the same ways as system architecture diagrams. Too much or too little information on the sequences and paths leaves viewers confused or wanting more.
To avoid these pitfalls, make sure to show all the key scenarios, including alternative paths and failures. Be clear when defining sequences of events. Do not exclude all the important steps, but do not overcomplicate things—find a good balance between complexity and clarity for your intended audience.
Example network diagram


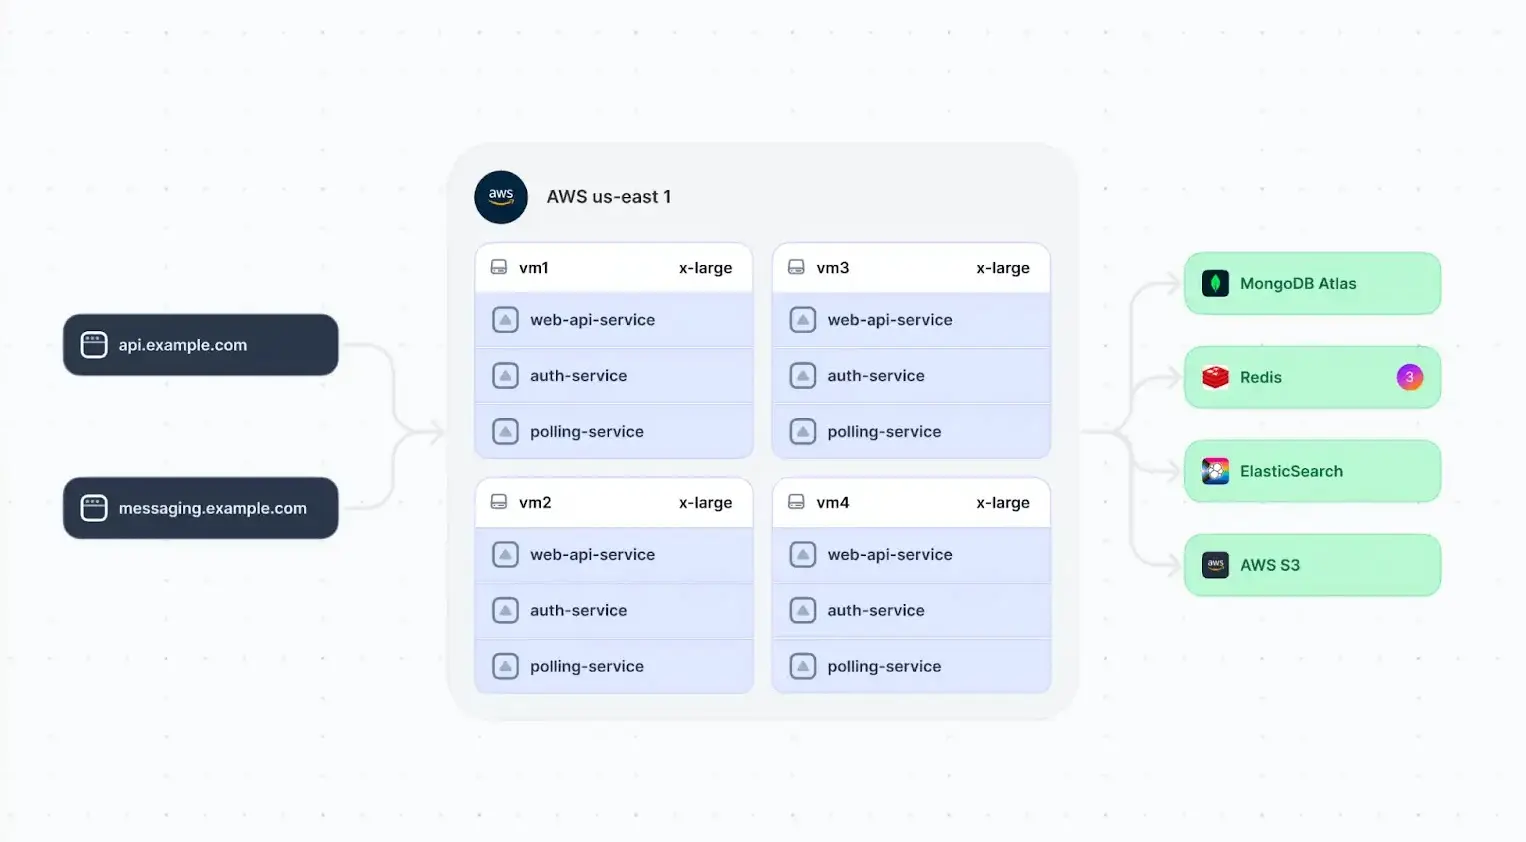
In this example of a network diagram, we see an API and a messaging interface and the connections between their cloud computing resources and several data stores. We see the types of compute resources hosting the services, namely the virtual machine instance cluster that scales to meet the demands of the API and messaging service.
Crucial elements of a network diagram
- Nodes: These include devices such as instances or routers (vm1 to vm4 computing resources in the example).
- Connections: These are the lines or arrows showing how these nodes are accessed and where they sit in the network flow.
- Network devices: Equipment like firewalls and load balancers used for network operations and safety are shown as groups of nodes.
- External interfaces: These are the junctures where the network connects to outside networks.
Potential pitfalls
Diagrams that visualize network infrastructure must be detailed and accurate to avoid misunderstandings. Leaving out components, especially those regarding network security and scalability, can have grave consequences for future system growth.
To mitigate these issues, be very clear about the important parts of your network. Resources involved in scaling, security, and external interfaces are of particular importance and should be highlighted. Find the balance between too much information and too little, and use groupings and colors judiciously in your diagram.
How to create software architecture diagrams
Creating impactful software architecture diagrams requires a deep understanding of the technologies utilized in your tech stack, clear presentation skills, and selection of suitable tools. As we have seen, it is essential to present things clearly to the target audience and get the balance right between showing too much and too little information.
Selecting the proper tools
Many diagramming tools are simple, easy to use, and rich in shapes and templates. However, a new generation of developer productivity tools allow developers to create dynamic diagrams and documentation that better capture the complexity of distributed systems and are directly tied to your running system. Here are some capabilities to consider:
- Keep diagrams in sync with reality: Automatically discover APIs, services, components, and dependencies so that diagrams always reflect the current state of the system.
- Centralize system knowledge: Link components directly to source code, APIs, and documentation to reduce context switching.
- Understand system behavior: Discover how frontend user interactions correlate with backend behavior through full-stack session recordings to help developers reproduce and debug complex issues.
- Document and share integrations: Embed executable code and API blocks directly into written notebooks to capture the steps needed to execute, test, and debug API integrations.
One click. Full-stack visibility. All the data you need correlated in one session
RECORD A SESSION FOR FREEAnother key consideration is support for AI-driven workflows. Tools that integrate with AI can generate code or documentation blocks from natural language instructions, automatically create test scripts from full-stack session recordings, and feed insights from those recordings into AI coding assistants to help developers trace issues, generate fixes, and accelerate debugging.
When combined, these features significantly enhance developer productivity by providing a living, actionable view of the system. If you are looking for a dedicated tool that supports all of these capabilities, consider a platform like Multiplayer.
Basics for creating diagrams
The process of creating a software architecture diagram can be broken down into five simple steps:
- Understand the system: Identify crucial elements like databases, services, and user interfaces.
- Select the diagram type: Choose a diagram that best represents the aspect of the architecture you are focusing on.
- Diagram clearly and concisely: Focus on essential elements and ensure that colors and labels for different types of components are standardized across the company for consistency.
- Refine with feedback: Continuously update and refine the diagram with team input by leveraging system design reviews for proposed changes, such as new features or refactoring efforts. Utilize comments for iterative feedback and discussion, ensuring continuous improvement and alignment.
- Document: Enhance diagrams with detailed annotations for clarity. Use colors, labels, and annotations with care to get your points across and refine the diagram with input from your team.
A practical software architecture diagram example: e-commerce monolith to microservices transformation
Here is an example of how diagrams can be used to design a transition from a monolithic to a microservices architecture.
Consider a fictional ecommerce company with a monolithic application architecture. The initial releases of the application were built using tightly coupled components, including the web server, database, payment processing, inventory management, and more. As the business scales, the monolithic application is becoming increasingly complex and difficult to maintain.
This monolithic architecture is leading to several pain points:
- Slow response times and frequent outages, especially during peak traffic periods like special sales and promotions. The database is becoming a bottleneck as complex queries slow down overall performance.
- Difficulty implementing new features and updates, since every change could potentially break existing parts of the system. A high degree of interdependence means small tweaks often have unintended side effects.
- Scalability challenges for traffic spikes, integrating new product lines and brands, and global expansion. Vertical scaling of monolith servers is costly and inefficient.
Diagramming techniques can help map out an incremental transformation to a microservices approach. Here is a simplified before-and-after view.
Before the overhaul:


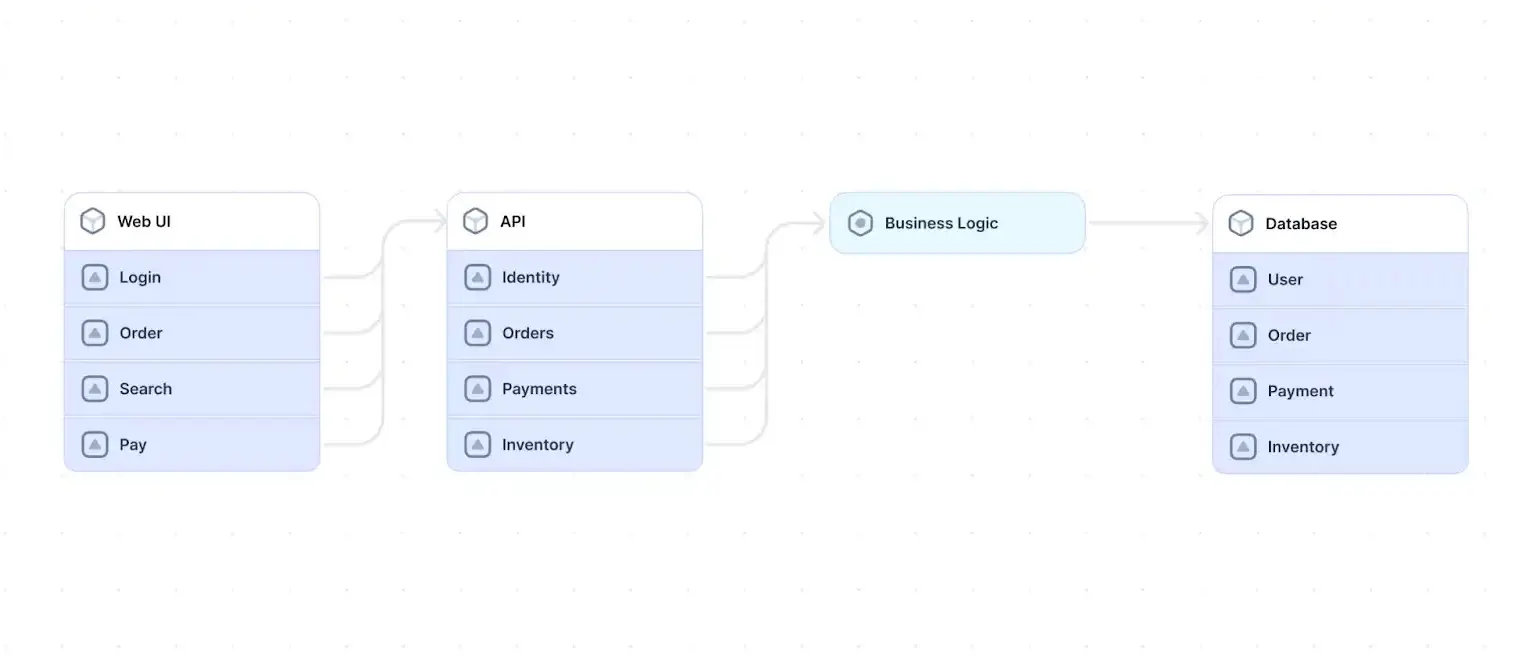
After the overhaul:


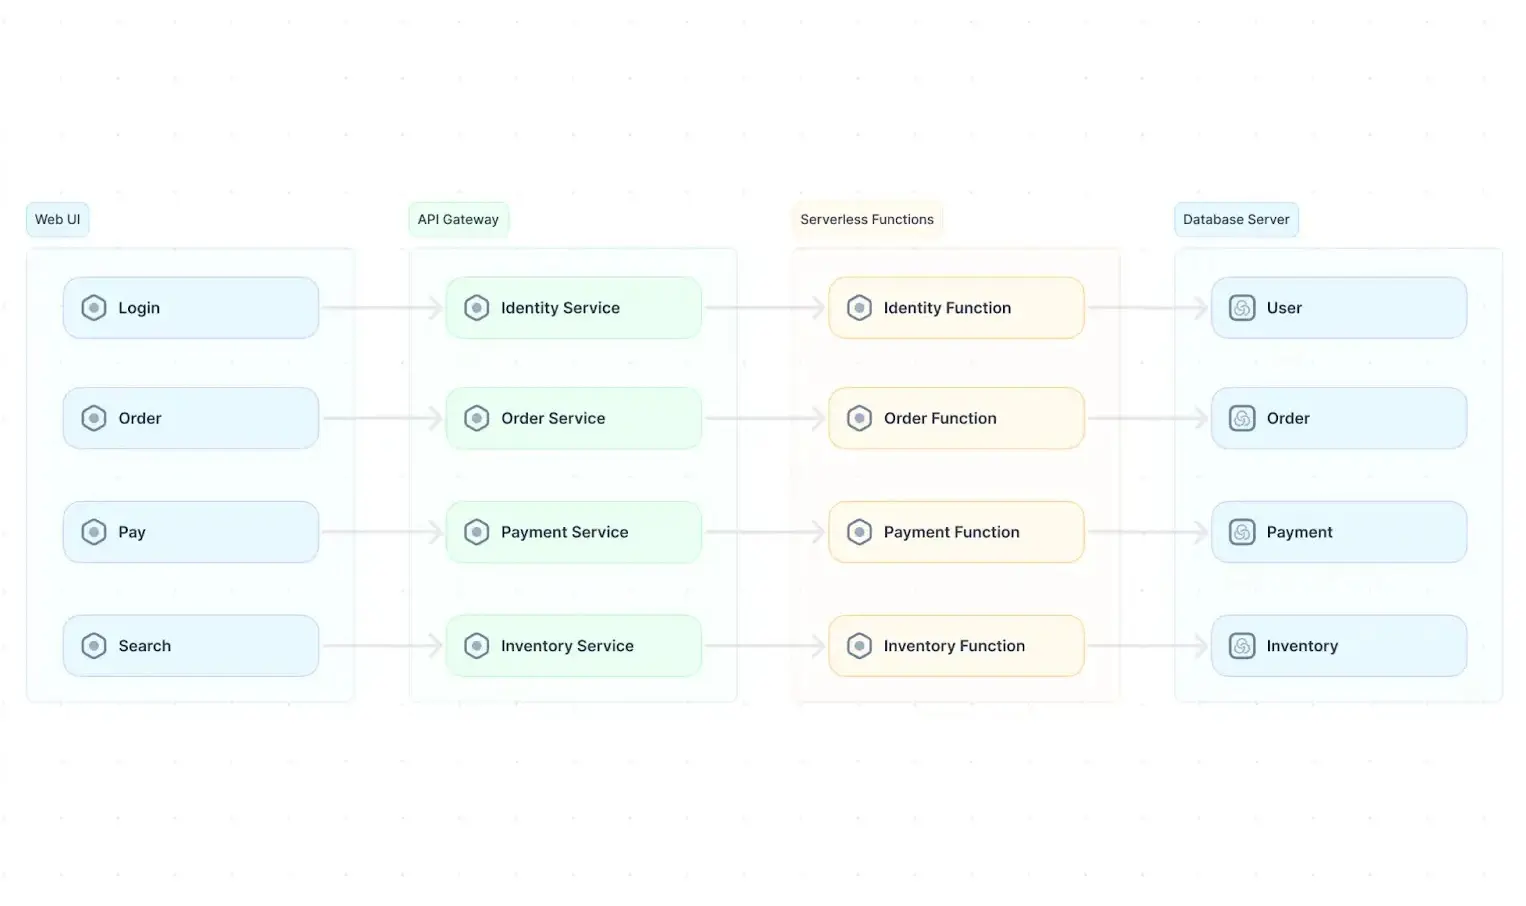
Visually modeling the desired architecture promotes important discussions on seams in the monolith that align with business capabilities. The diagrams serve as blueprints to plan and coordinate the migration iteratively while preventing wide-scale downtime.
In later stages, the diagrams can facilitate monitoring dependencies across services as the landscape diversifies with cloud-native deployment options.
Diagramming can help the company visualize, strategize, and manage the decomposition by providing:
- A common language and understanding across teams
- Insights on progressive decoupling paths balanced with business priorities
- An evolving architecture map as new capabilities are extracted
This example illustrates the immense practical value of software architecture diagrams in orchestrating real-world migrations of this nature in a structured manner. Applying these visualization techniques is an important step in choosing a suitable architecture for applications of varying sizes and complexities.
Stop coaxing your copilot. Feed it correlated session data that’s enriched and AI-ready.
START FOR FREEConclusion
Software architecture diagrams are vital tools in modern software development. When used effectively, they become instrumental in designing, developing, and managing complex systems.
Software architecture diagrams also offer a visual narrative that enhances understanding, streamlines communication, and fosters effective decision-making about technical systems. We hope that the discussion and examples in this article will help your team leverage software architecture diagrams effectively in current and future software projects.