Guide
API Flow Diagram: Best Practices & Examples
Table of Contents
As modern software applications and platforms embrace the shift to cloud-based operations, API-based interactions have become very common. Microservice architectures often use internal APIs for communication between microservices, and many software products provide external APIs to users. As these applications evolve, existing API behaviors constantly change, and new APIs are introduced. In addition, individual API behaviors also become complicated as applications seek to expose larger functionalities through APIs. Over time, it becomes increasingly challenging to keep track of all the application APIs along with their expected behavior under different scenarios.
API flow diagrams address this challenge by visually representing the interactions among the different internal components of the system affected by a given API. They help with clearly defining and communicating the expected behavior of an API in various levels of detail.
In this article, we discuss API flow diagrams, best practices to ensure they are effective, and various challenges teams face while using them. We also take a look at how these diagrams are evolving and how API documentation is likely to change going forward.
Summary of key API flow diagram concepts
In this article, we explore the following important aspects of API flow diagrams:
| Concept | Description |
|---|---|
| What are API flow diagrams? | API flow diagrams are a visual representation of API behavior. |
| Use cases | API flow diagrams are useful in a range of scenarios, such as defining API behavior, onboarding new team members, and easing collaboration within larger teams. |
| Types of API flow diagrams | System diagrams, sequence diagrams, and environment diagrams represent different aspects of an API’s interaction with a system. |
| Best practices | Focus, abstraction, standardization, and maintenance are essential practices for creating effective API flow diagrams |
| Looking ahead | An increase in the use of generative AI is leading toward automatic syncing between code and diagrams, which can enhance the usefulness of these diagrams. |
Why API flow diagrams are needed
API flow diagrams are a visual representation of the expected behavior of the API in different scenarios. This behavior is shown through the interactions among different internal components of the system that the API uses over the course of its execution.
API flow diagrams seek to address various challenges that API development teams face over the lifecycle of an API. When utilized properly, they ease communication and collaboration and help ensure consistent API behavior over time.
As an example, consider an API server for a bank. The development team is in the process of designing an API to create customer bank accounts. Customers would interact with this API via a web or mobile application, and over the course of the API's execution, it would need to call a number of services. It would first need to check if a user already exists in the system and has the privileges to create an account. It could then make a number of checks about the user, such as whether the user already had the same kind of account, had the required credit score to open it, had any known criminal cases pending, etc. Each of these validations would require checks in different parts of the banking system and would result in internal API calls to different services.
The API would also be expected to behave differently based on the results of these subsequent API calls. Thus, the API’s expected behavior encompasses a large set of possible behaviors based on different external factors. It is important to define this expectation clearly and communicate it to all stakeholders involved in creating and maintaining the API. If the development team is unable to visualize the entire behavior of the API, it is highly probable that changes to intermediate systems would be incompatible with the overall API behavior and cause it to change or break.
This problem grows exponentially with the size of the development team. Large teams are constantly changing: Developers may leave, taking their detailed knowledge of the API with them, and it becomes a huge challenge to onboard new members of the team and explain to them the high-level functioning of the system and its APIs.
In addition, if different teams work on each of the various services involved, each team requires knowledge of what the overall API is intended to do. In our banking system example, if the team involved in checking credit scores suddenly changes the scoring system without knowing all the upstream APIs that use it and how they interpret the score, it could lead to serious errors and unexpected API behavior.
Full-stack session recording
Learn more


Use cases for API flow diagrams
Effective API flow diagrams document the complex behavior of an API in a concise and readable way. The internal components of the applications involved in the API’s execution are abstracted as actors in the system or as labeled symbols so that the reader can focus on the overall flow of the API.
API flow diagrams provide benefits within a given team because new members can study them during onboarding, which helps new developers more quickly gain an understanding of the overall system and how their individual changes and contributions to the codebase could affect other components and teams.
Across teams, API flow diagrams enable easier collaboration and communication. It is much simpler for a software architect to explain to a development team how the subsystem they are building is expected to behave when the developers involved have an API flow diagram to study.
These diagrams also serve as documentation, providing a precise description of the API’s behavior against which its implementation can be tested to ensure correctness. They remain a source of truth for the future, ensuring that code or configuration changes do not introduce problematic changes or cause unexpected behavior. If they do, well-crafted diagrams aid in identifying and fixing these issues earlier and more quickly. In our bank example, it would be much simpler to identify which APIs need to be tested when the credit score system is changed if the right API flow diagrams are in place. Any disagreements between teams about the API’s expected behavior can be resolved by referring to the diagram.
Types of API flow diagrams
A variety of different types of diagrams have evolved over time to show API behavior. In this article, we will focus on three diagram types that can be used to represent three distinct aspects of an API as it interacts with a system: system diagrams, sequence diagrams, and network/environment diagrams.
System diagram
A system diagram provides a high-level overview of a system. All the components that make up internal subsystems are shown using a single architectural block in the diagram, allowing developers to focus on the high-level flow of communication between components.


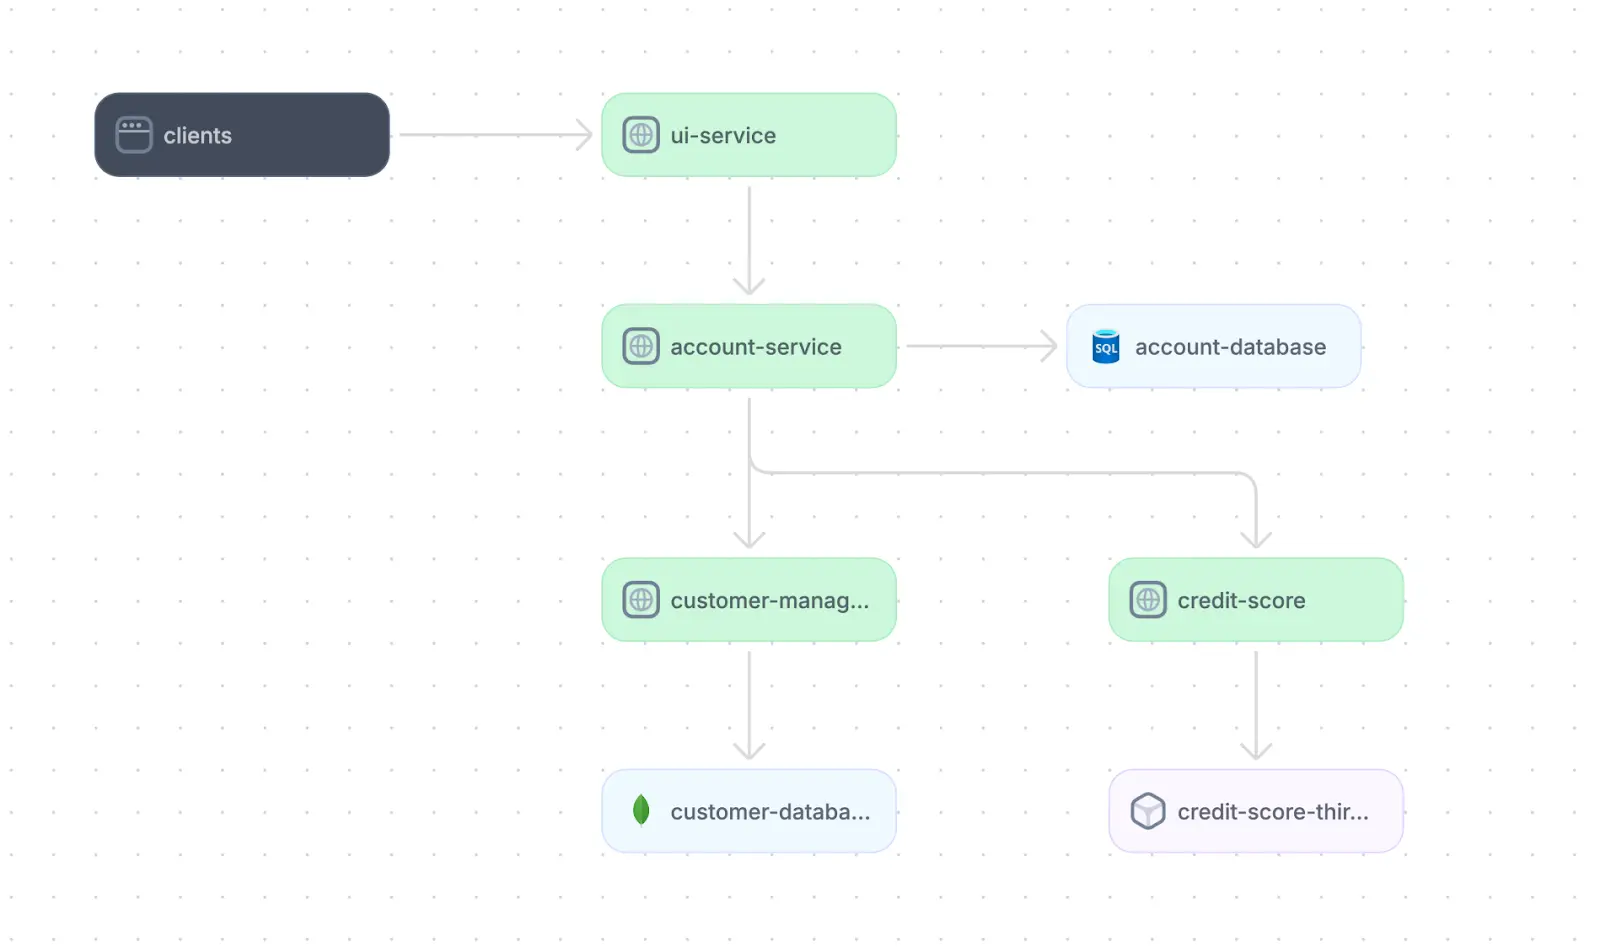
Example system diagram for a “create account” API
Using a high-level representation like this can help document an API’s general structure without getting too deep into the details of each component’s internal behavior. System diagrams can be used to get an initial, introductory understanding of how the API is expected to behave and which components of the system will be involved in various transactions. This can help you identify which developers or teams will be needed to build features and get a sense of the internal interfaces required.
Sequence diagram
Sequence diagrams represent the different components of the system or API as the origins of vertical “lanes” in a timeline. The API execution begins at the start of this timeline, and the flow of requests and data over its lifetime is indicated by horizontal arrows across the lanes. This allows you to focus only on the components of the system that are involved in the API’s execution, potentially at a more granular level than is achievable using a system diagram.


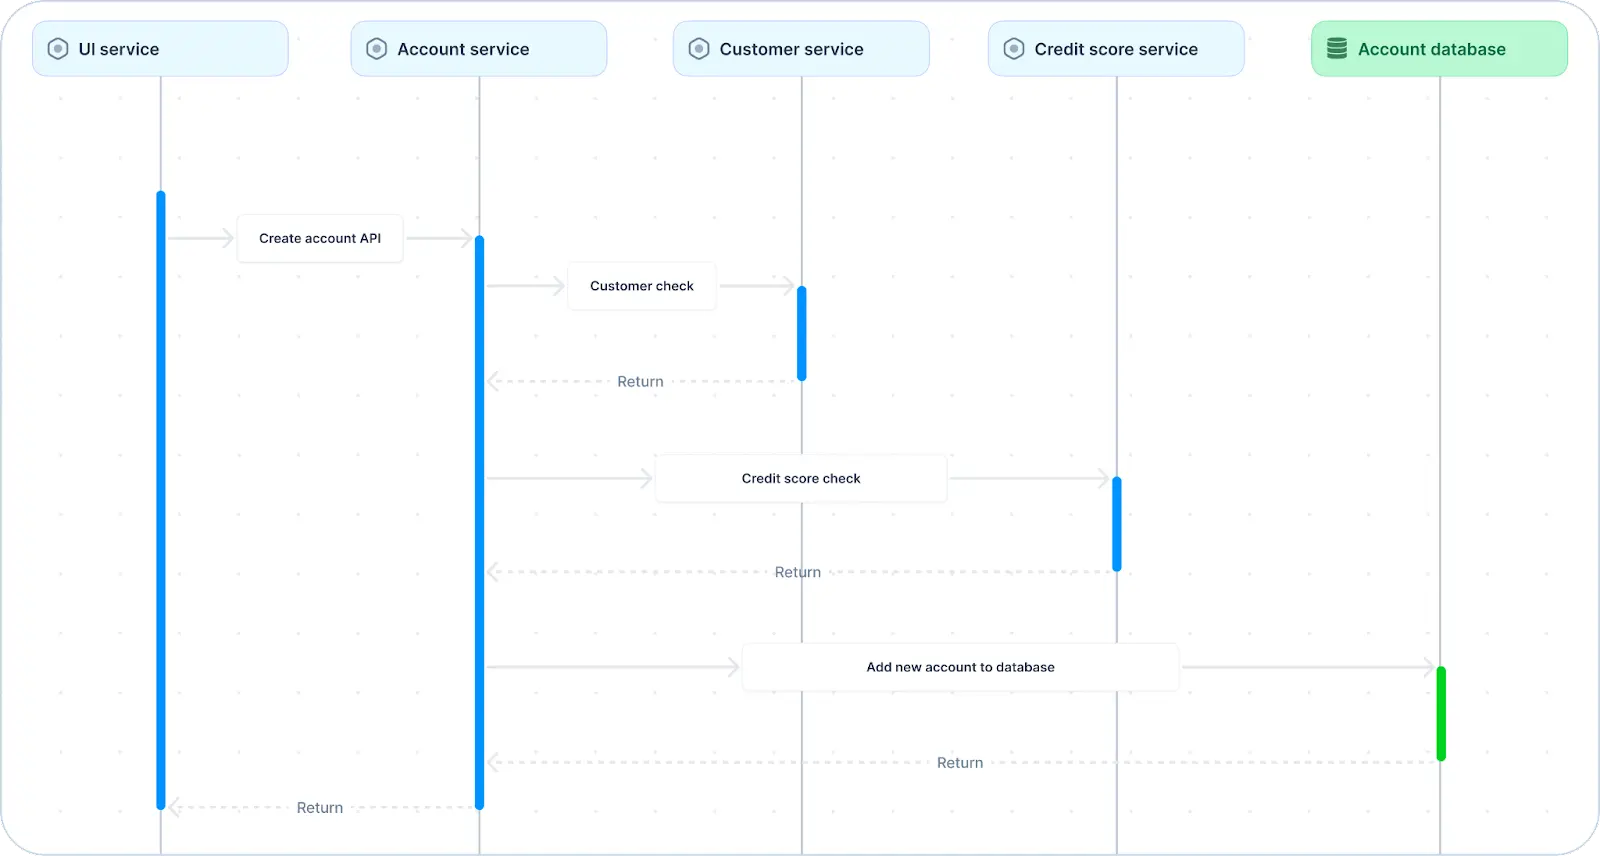
Example sequence diagram for a “create account” API
In addition, sequence diagrams show exactly which components are responsible for which part of API execution, allowing developers to identify bottlenecks and make performance optimizations. While a system diagram gives an overall view of which part of the system would be affected by a particular API execution, the sequence diagram gives a clearer idea of the order in which those parts come into the picture.
Interact with full-stack session recordings to appreciate how they can help with debugging
EXPLORE THE SANDBOX(NO FORMS)
Deployment/environment diagram
While system and sequence diagrams deal with the components of the system in a conceptual and architectural manner, the environment diagram deals with the actual deployment. It shows details such as different networks, gateways, load balancers, and service execution environments - such as Docker containers or Kubernetes pods - that would come into play during the execution of an API. This helps provide an idea of a system’s operational aspects, such as the amount of traffic a particular API is expected to bring in and which parts of the system’s network may not be able to handle this level of traffic. Environment diagrams can help with managing the effects of anticipated API load early, providing insights into where developers may need to adjust bandwidth, add a load balancer, or otherwise scale services.


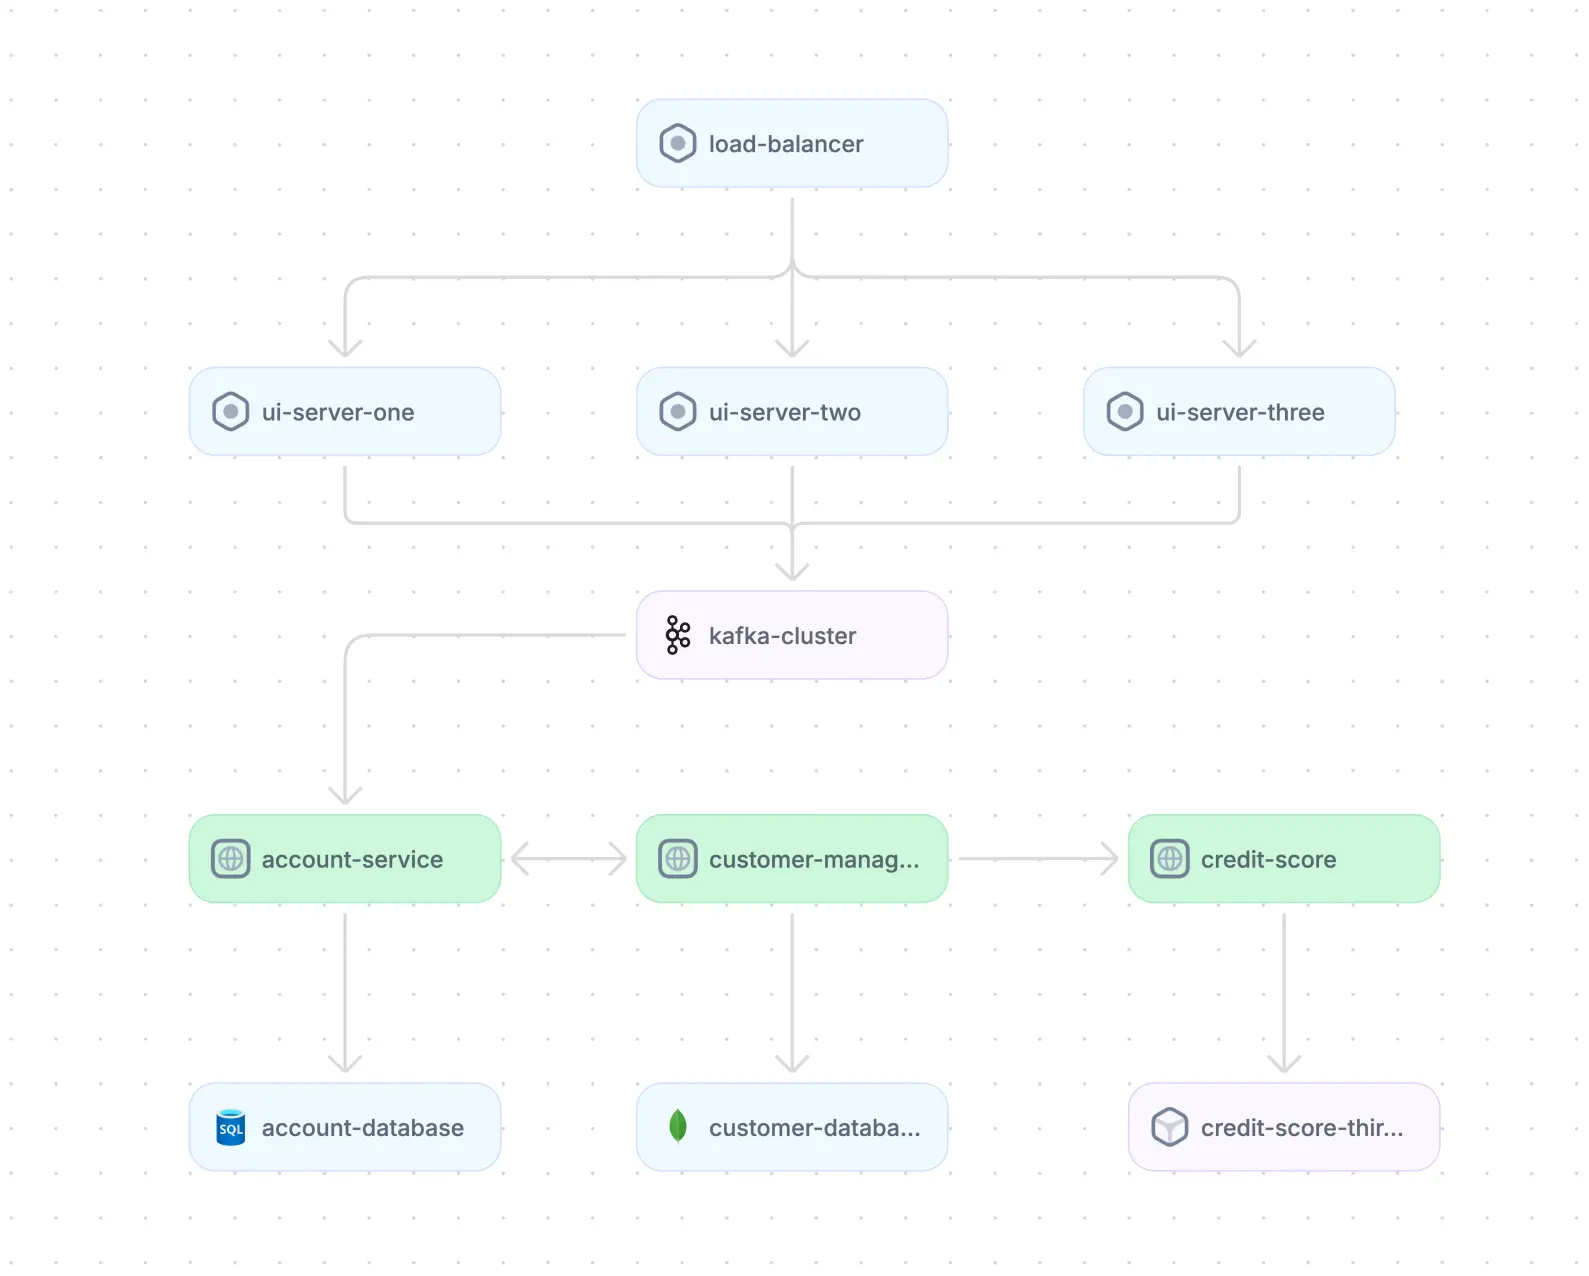
Example deployment diagram for a “create account” API
API flow diagram best practices
We have seen how API flow diagrams can be useful in multiple ways. However, if they are not designed and managed well, they can end up actually making API development more difficult. In this section, we will look at some best practices for creating clear, effective, and useful API flow diagrams.
Focus on relevant components
All types of API flow diagrams should communicate necessary information without distracting the reader with extraneous details. The main aim should be readability, even if it comes at the cost of losing a small amount of information.
To this end, developers should strictly avoid overengineering design diagrams. Each diagram should show only those components of the system that are impacted as a part of a given API flow. One way to accomplish this is by using a tool that supports different views–i.e., subsets of components or subsystems–of the system architecture. Tools like Multiplayer allow developers to create filtered views to highlight the most relevant components or exclude unrelated components in the context of a given API flow.
One click. Full-stack visibility. All the data you need correlated in one session
RECORD A SESSION FOR FREEChoose the right level of abstraction
For each component involved in an API flow, diagrams should show only the level of internal detail necessary to achieve the goal of the diagram. For example, when creating a system diagram that gives an initial introduction to API behavior and interactions, diagram creators should keep component details fairly high-level. If the diagram includes too much detail of (for instance) the classes and objects making up an architectural component, the diagram could become too cluttered to clearly represent the overall API structure.
When creating sequence diagrams, developers should keep in mind that each diagram can have varying amounts of detail based on its intended audience. For instance, if a sequence diagram is created for a system architect to view, it might show a high-level view of services in a single swimlane without providing many additional details on each service’s behavior. However, if the sequence diagram were created for the lead developer for the service, it might show each class or package within a specific service for a more detailed view of the interactions within the service because of the API call.
Once the scope and level of abstraction have been decided, it is important to ensure that the diagram is sufficiently thorough and detailed to convey all of the intended information. A single API's execution typically involves a number of services interacting with each other, multiple database reads and writes, parallel and serial processing, and so on. Since the API diagram is meant to be a complete definition of the API's behavioral expectations, it should show all aspects of this behavior.
To this end, we recommend keeping the following practices in mind:
- Clearly show interactions between services and components, including messages and payloads where necessary.
- Show databases with brief mentions of what type of data will be stored or queried from them.
- When creating sequence diagrams, show which parts of the processing can be done in parallel and which need to be serially executed
- When creating network diagrams, show network boundaries and gateways to better plan how traffic can be directed and managed by components like load balancers and API gateways.
Use standard symbols
For consistent readability across different diagrams, organizations should carefully choose and document which symbols, colors, layouts, and typography they intend to use to represent various types of system components. Common components to display in diagrams include APIs, message queues, databases, frontend interfaces, and caching solutions.
Keep in mind that the two primary goals of API flow diagrams are to enhance communication and speed up onboarding processes. Maintaining consistent styling and representation of components across diagrams helps developers read and digest relevant information more quickly.
Keep diagrams up to date
Keeping all aspects of documentation up to date has become an essential development practice with the rise of agile methodologies and SaaS applications, which in turn have led to very fast development cycles. If developers create precise API flow diagrams while developing APIs and then are lax in maintaining them, the diagrams will very soon become stale and unusable. This complicates collaboration and communication rather than easing them, as developers will make changes based on outdated or inaccurate assumptions about the API’s behavior. For diagrams to remain valuable, they must be updated along with code changes to the API.
There are many tools and visual frameworks that can be used to create consistent and visually appealing diagrams. However, advanced tools like Multiplayer offer several benefits beyond conventional diagramming tools. First, the platform leverages OpenTelemetry to automatically discover and document system architectures, which alleviates pain points around manually creating and updating diagrams. In addition, its system dashboard provides an overview of the system’s components, APIs, platforms, environments, and dependencies enriched with live telemetry data from the running system.
AI and the future of API flow diagrams
As developers increasingly begin to leverage AI in their workflows, they are leaning more and more on AI tools to automatically generate auxiliary content like software and API documentation. Software architecture diagrams are part of this trend, as teams are now realizing how AI tools can help ensure software diagrams are optimized and kept updated when given the right insights into the system architecture.
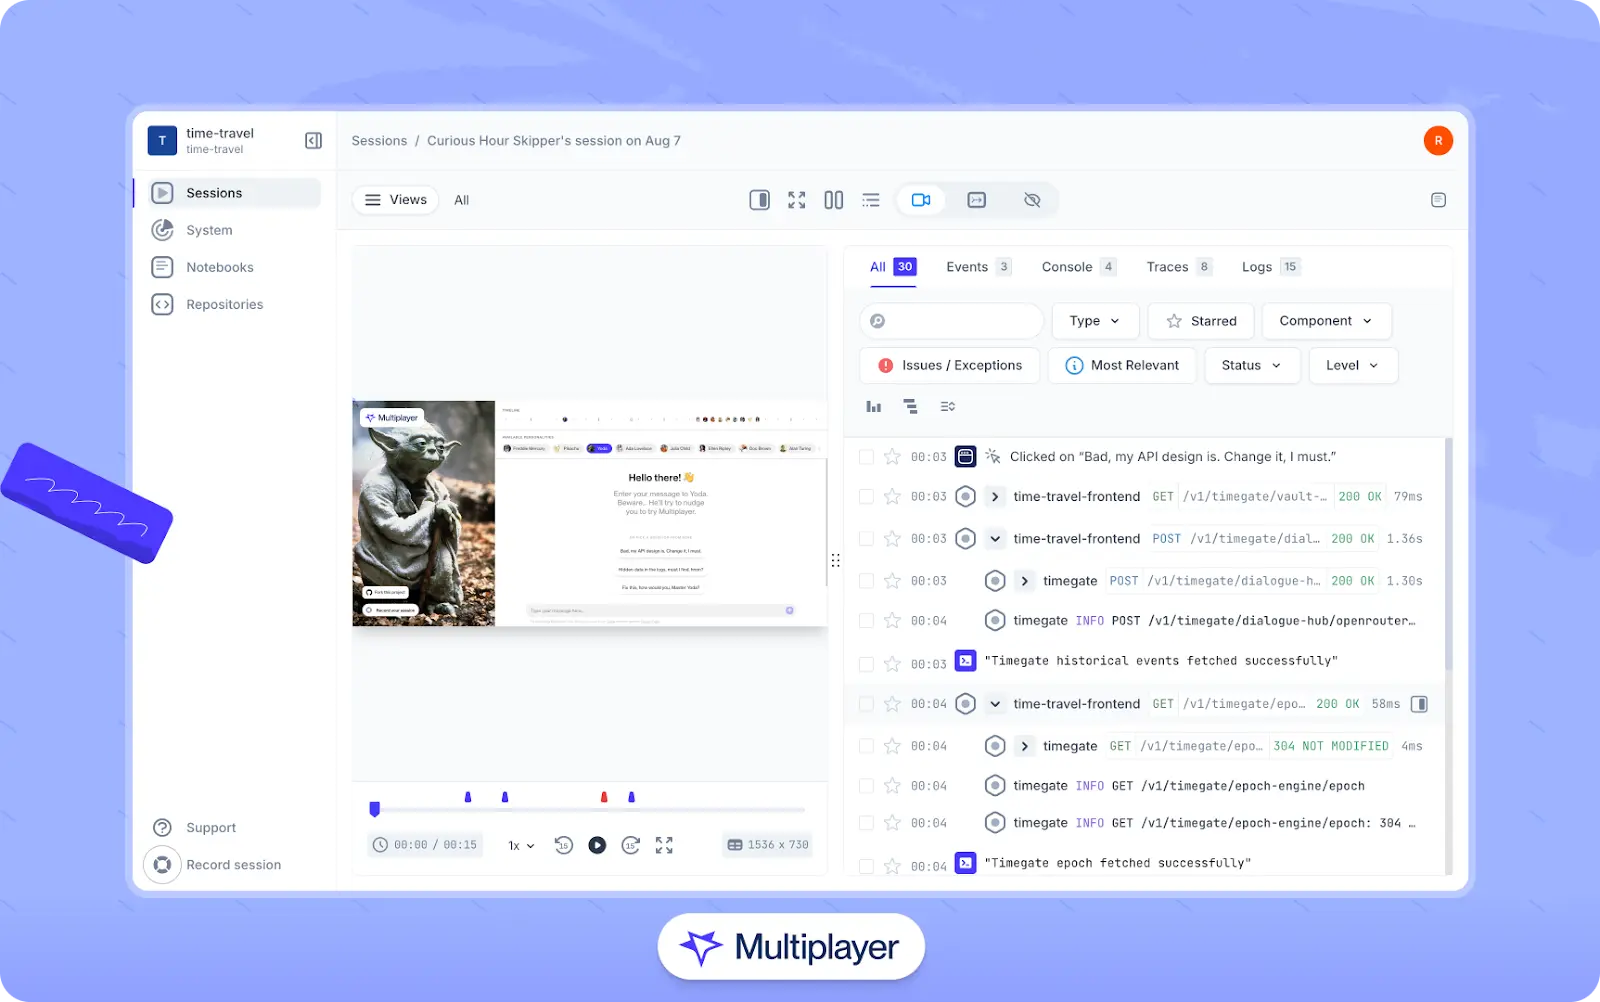
However, AI integrations can go further than simply generating diagrams. Platforms like Multiplayer capture full-stack session recordings that track correlated frontend interactions, backend traces, logs, and API requests. Developers can use Multiplayer’s MCP server to feed this contextual data into AI coding assistants, gain further insights into the state of the running system, and use these insights to fix bugs, validate API flows, and add context to software architecture diagrams.
AI tools can also be used to generate executable API documentation based on natural language and auto-generate runnable test scripts from full-stack session recordings. As AI capabilities continue to advance, we can expect even more intelligent ways to analyze, visualize, and maintain API flows directly from live system data.


Multiplayer’s full-stack session recordings
Stop coaxing your copilot. Feed it correlated session data that’s enriched and AI-ready.
START FOR FREEConclusion
API flow diagrams are a powerful tool to enhance collaboration while developing software applications and platforms. Different types of API flow diagrams - such as system diagrams, sequence diagrams, and environment diagrams - can be used to communicate different aspects of the API’s flow.
However, API flow diagrams can cause issues if they are not properly created and maintained. Following best practices and utilizing powerful visualization tools like Multiplayer will allow your team to leverage the greatest benefits from API flow diagrams, leading to more efficient workflows, faster development cycles, and improved software quality.