System dashboard
The Multiplayer system dashboard allows you to visualize your entire system at a glance, auto-populated and in real-time. It summarizes all your system components, APIs, dependencies, and environments in table or diagram format.
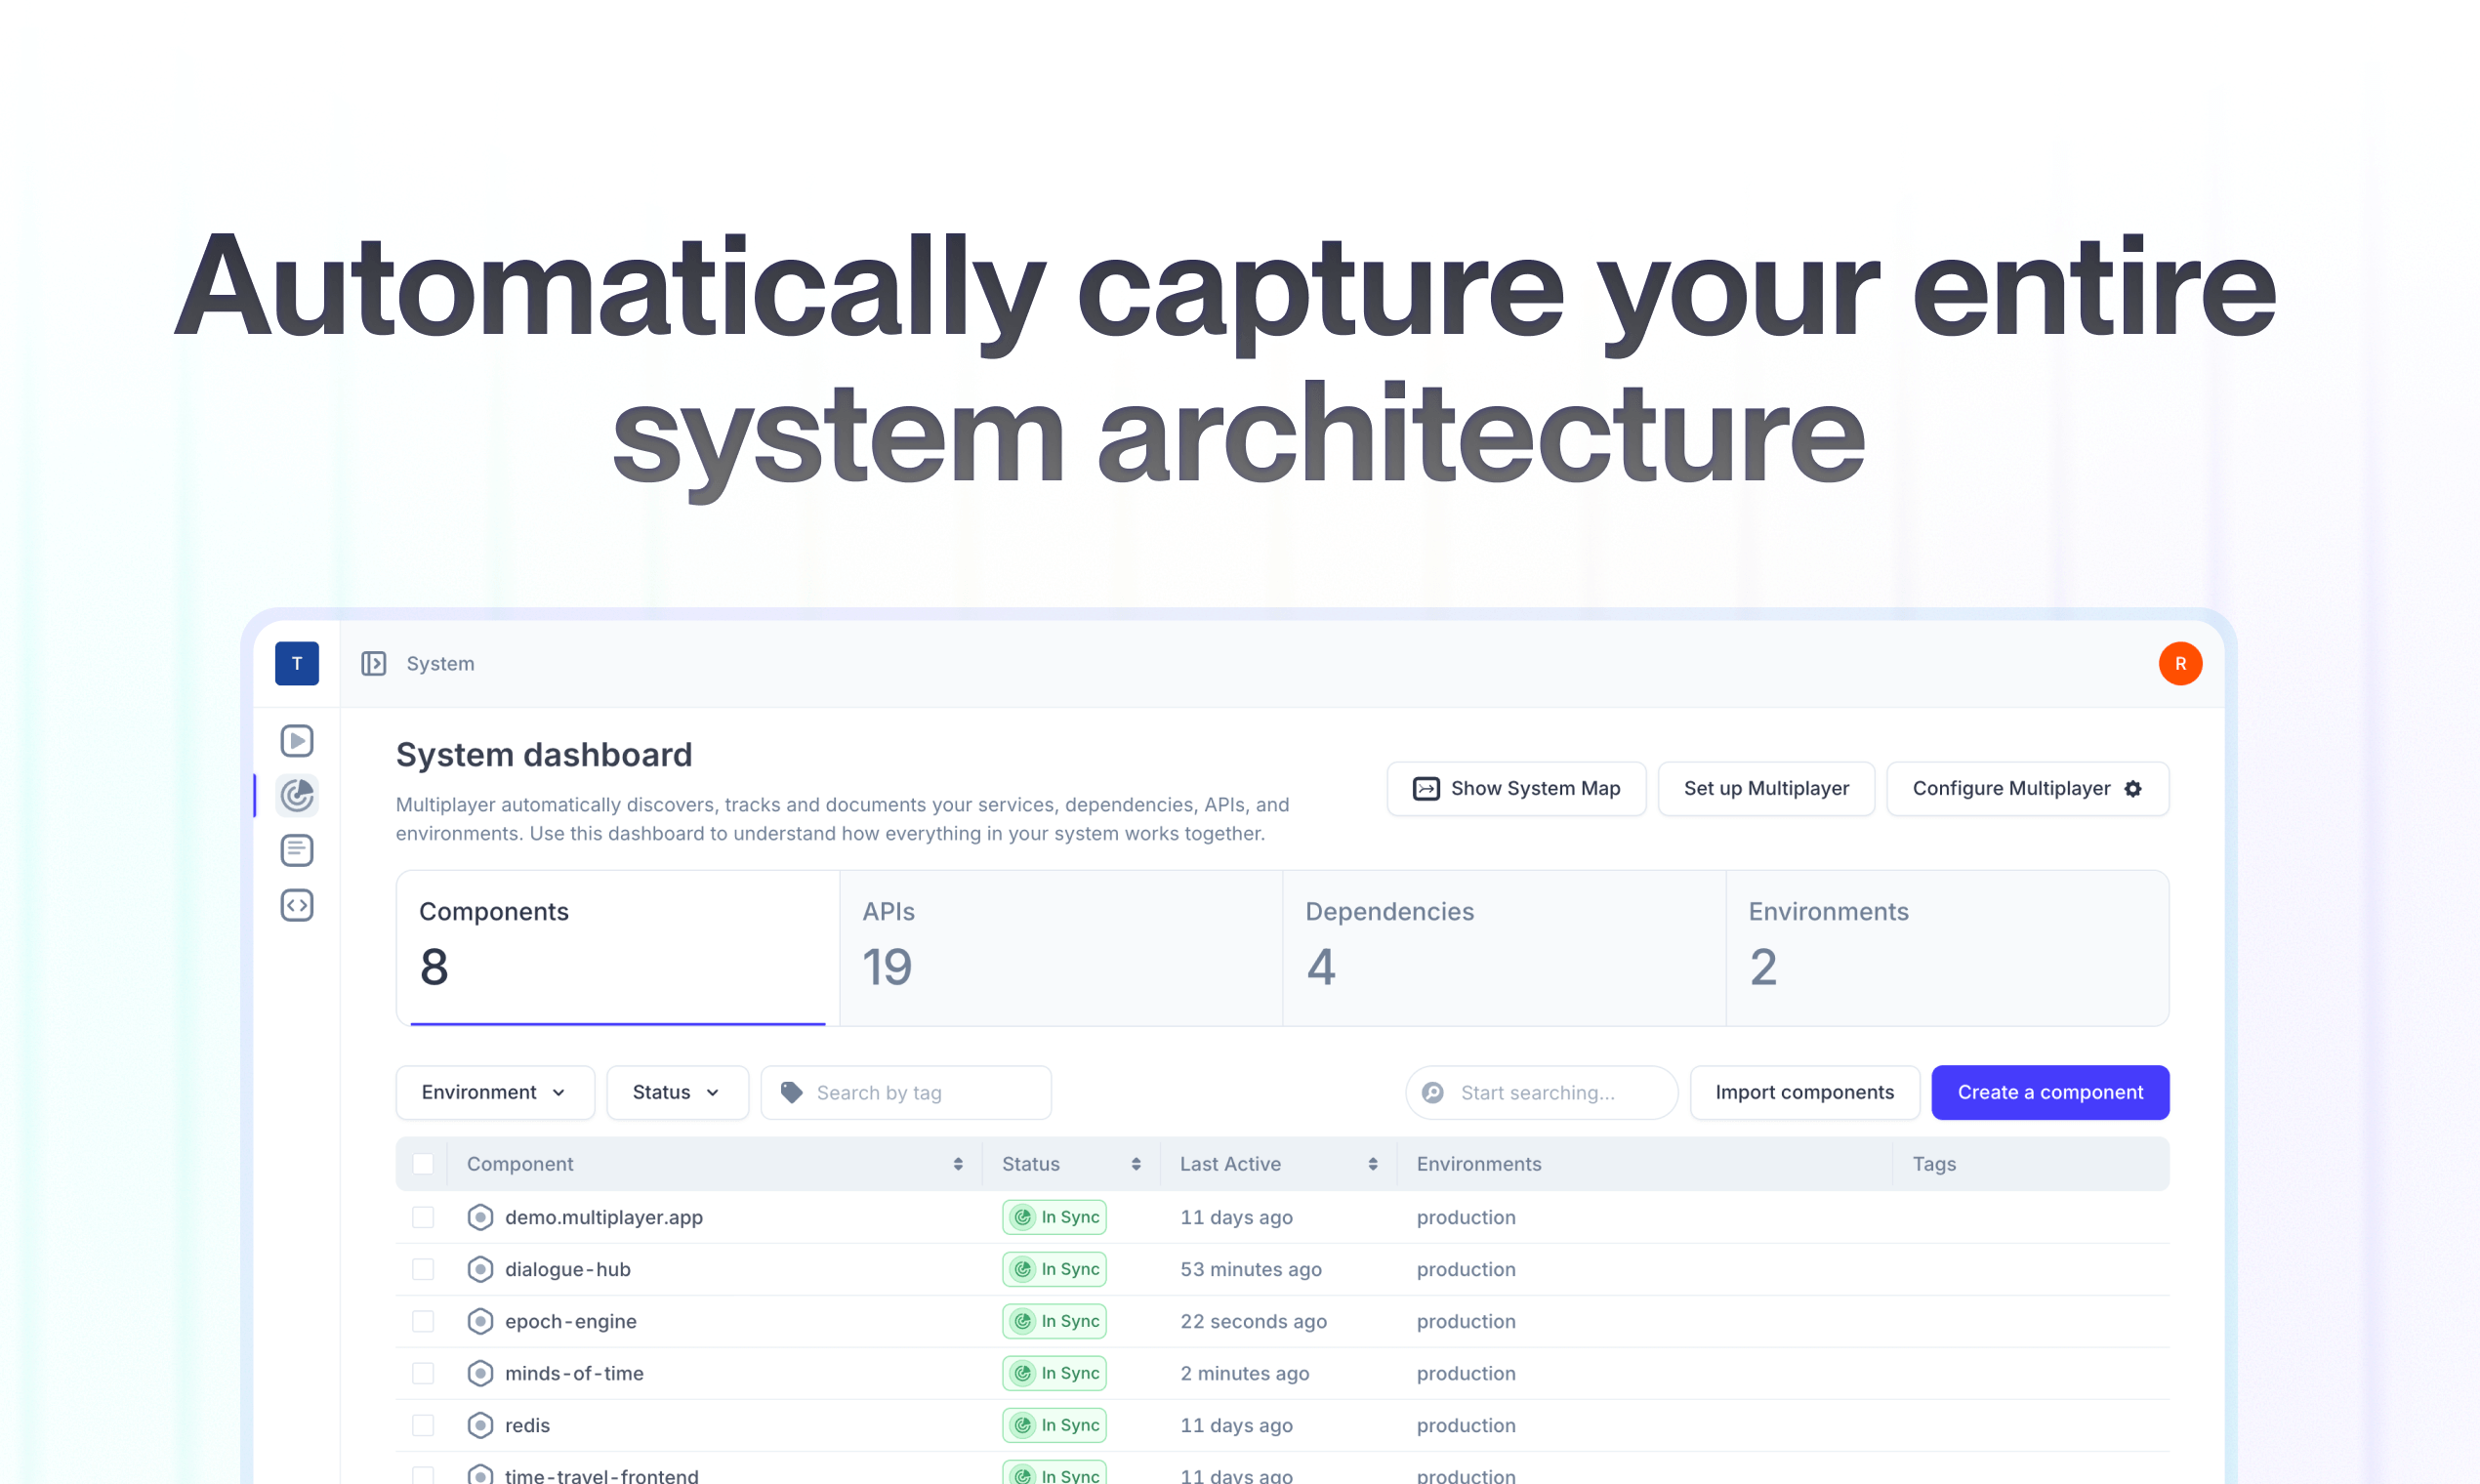
You can find an example system dashboard in our free sandbox: sandbox.multiplayer.app
Automating architecture diagrams
When you fully configure Multiplayer, we leverage the backend information incuded in full stack session recordings to automatically discover, track, and document your components, dependencies, APIs, and environments.
By clicking on "Show System Map" you can visualize (and edit) this information as a auto-generated system architecture diagram.
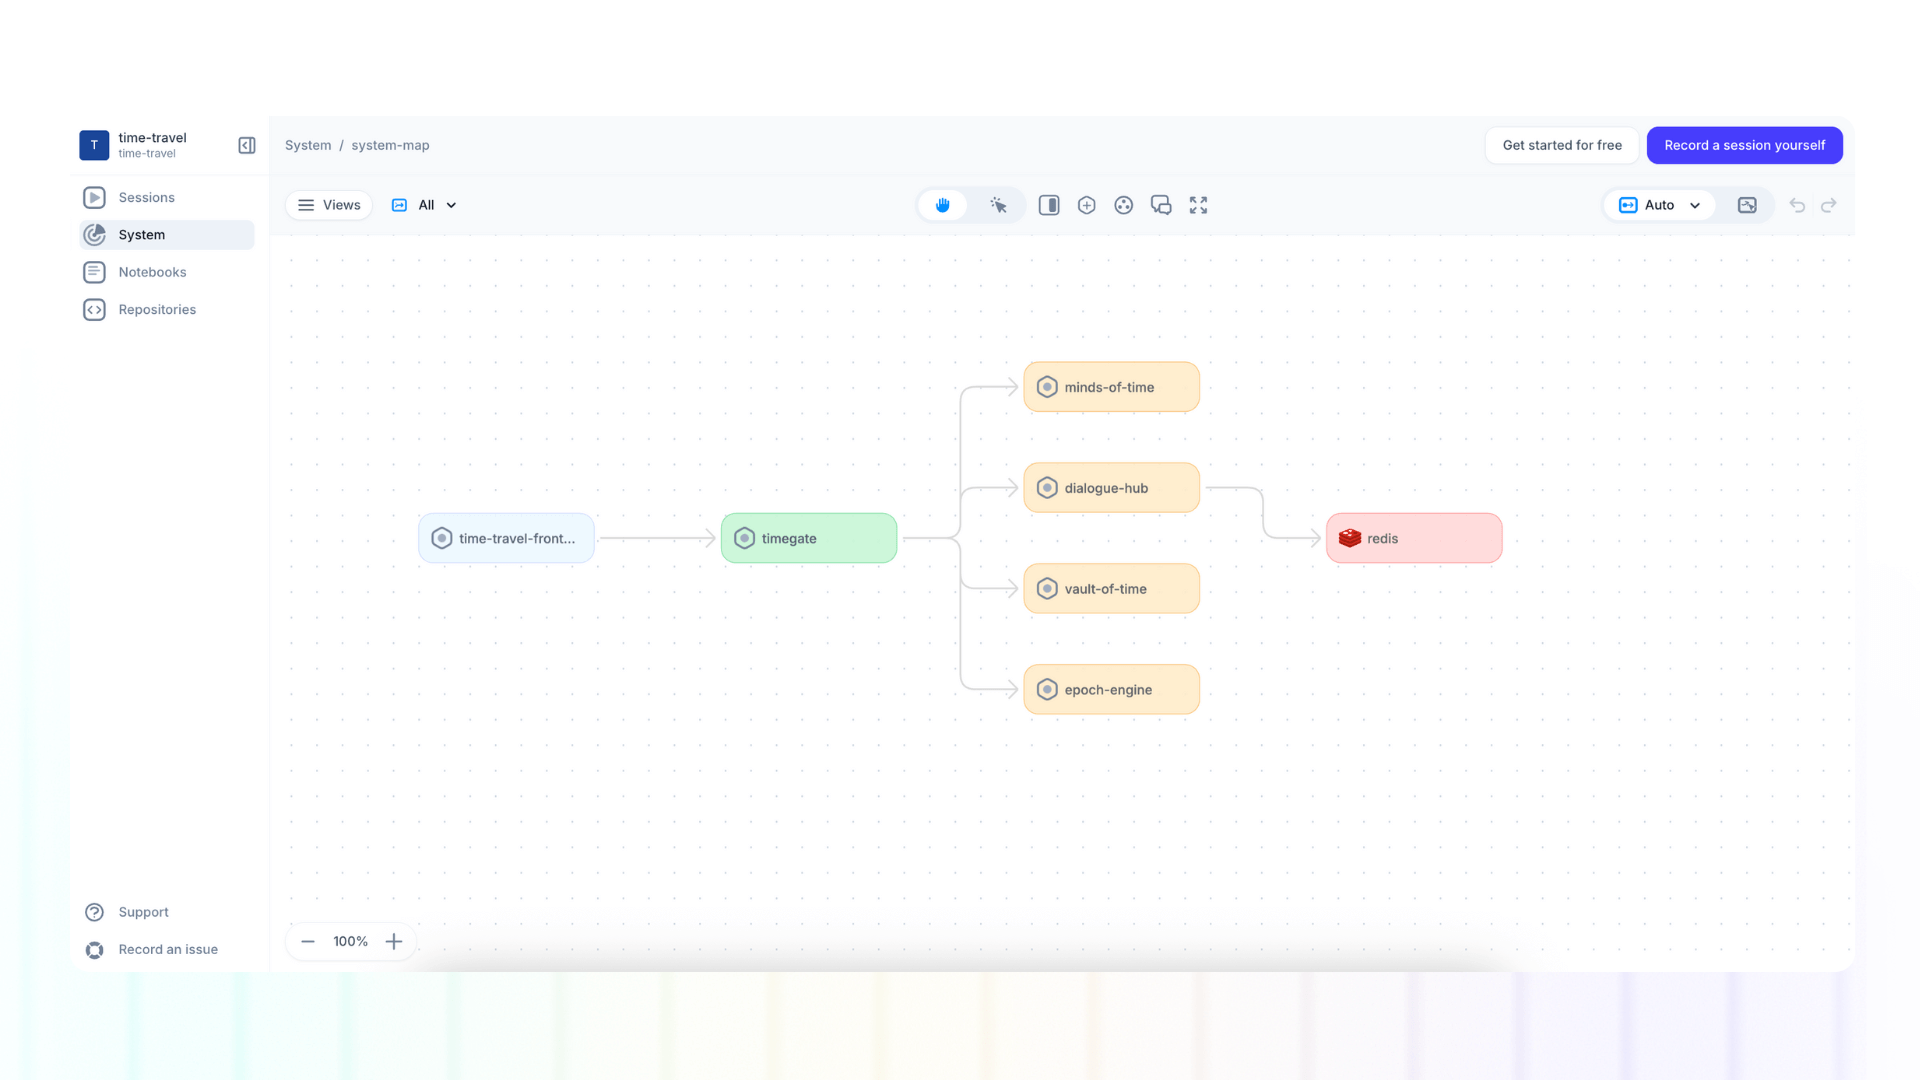
Our objective is to reduce the burden of manual system documentation on your team, while providing you with an always-up-to-date, accurate, and centralized view of your system architecture. You can:
- Debug complex systems with a end-to-end understanding of the architecture and all the individual components, dependencies and APIs
- Efficiently manage legacy systems, making sense of outdated or undocumented code
- Collaborate on system designs with real-time visibility and shared understanding
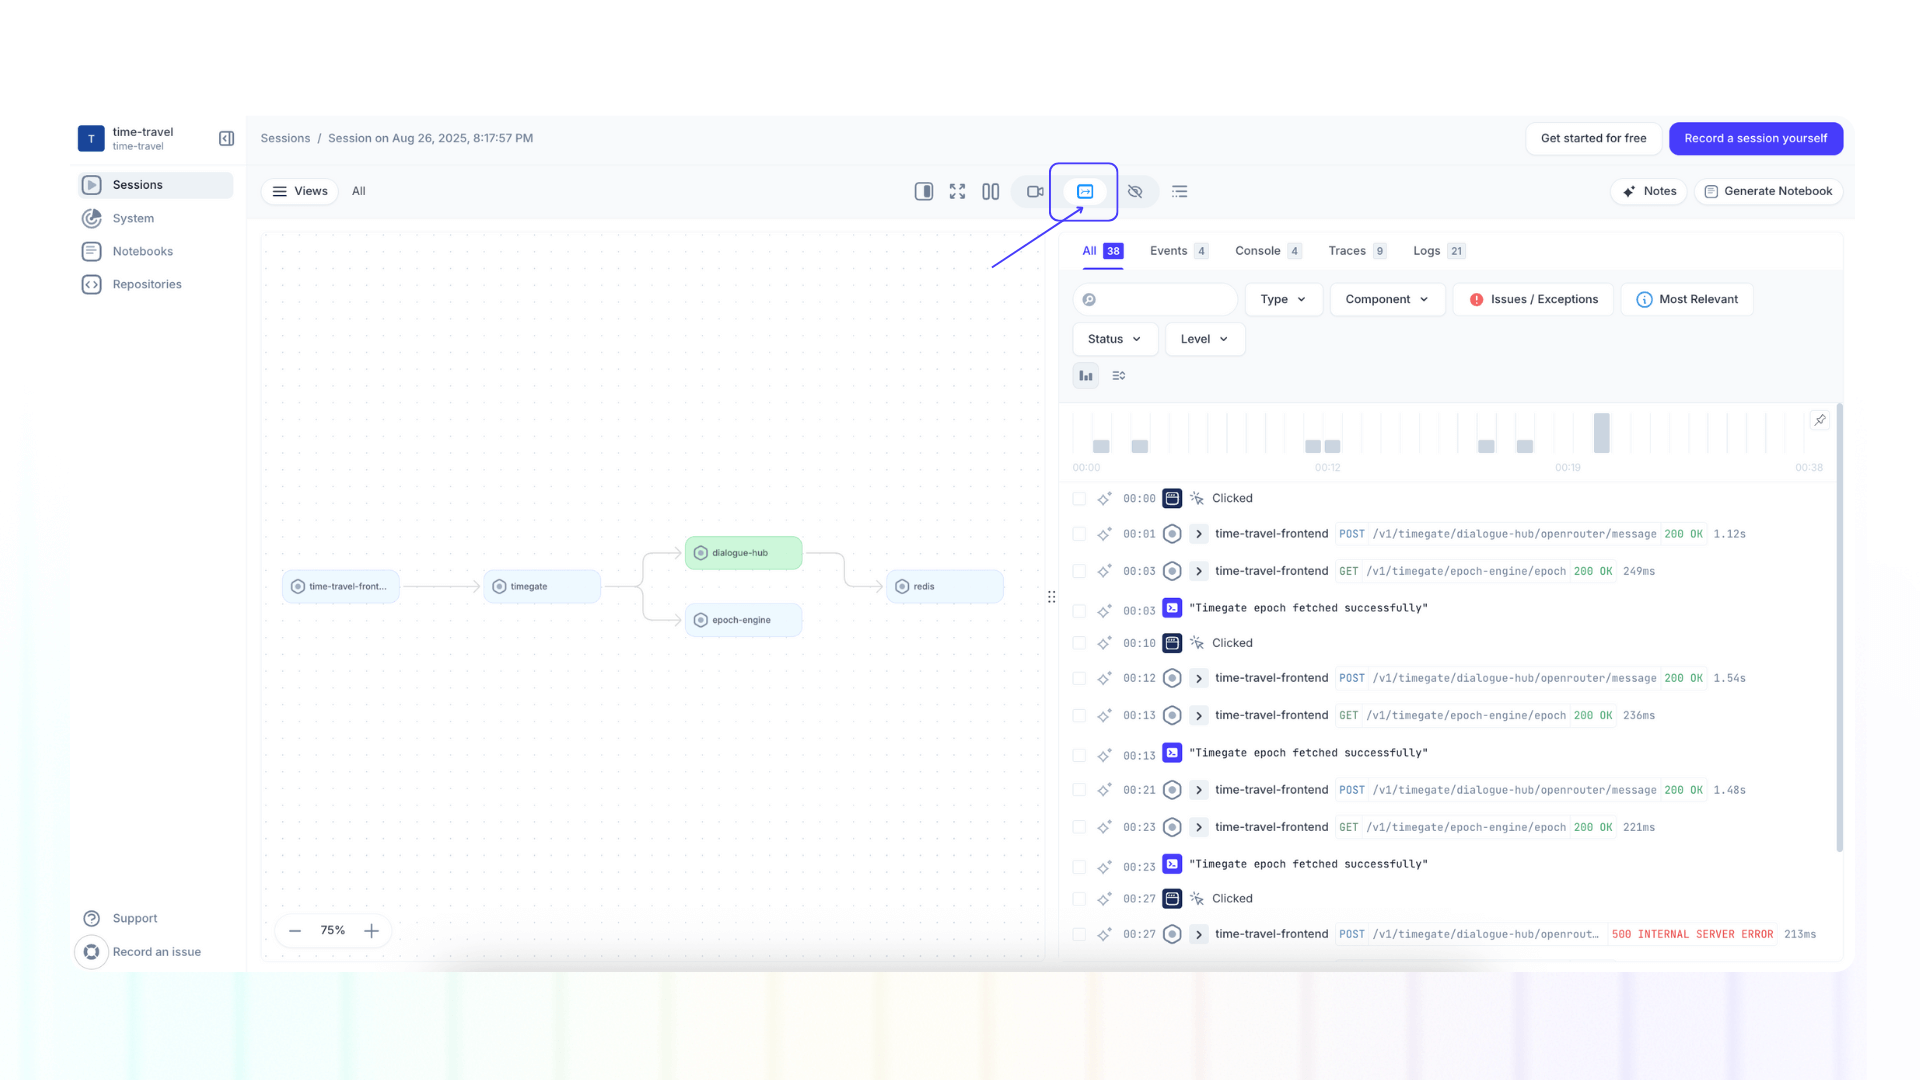
Integrated with full stack session recordings
The system dashboard and full stack session recordings are deeply integrated: we leveraged backend data from session replays to map your system, and within each session replay you can find a filtered view of the system map showing the affected components and dependencies.
To visualize the system map per session recording:
- Open Sessions and select your desidered session recording
- Select "system map view" in the top navigation bar
FAQs
- How can I edit my system map?
- How can I edit my system dashboard?
- What are the use cases for the system dashboard?
- How is the system map / dashboard different from other diagramming tools?
Next steps
You did it! What’s next?
- Capture a full-stack session recording
- Integrate with your favorite AI coding tool using our MCP server
- Build, test, and debug API integrations with ease
��📌 If you have any questions shoot us an email! 💜