Guide
Session Recording Tools: Use Cases & Examples
Table of Contents
Session recording tools have become an integral part of the modern software development lifecycle. UX-centric recording tools focus on user analytics by recording browser DOM changes and click paths, while developer-centric session recording tools combine frontend actions with backend telemetry to provide a more comprehensive picture of full-stack system behavior and performance.
Session recording has also become more powerful with the rise of AI. Developers can now utilize session recording tools to provide contextual input for copilots, agents, and AI IDEs, helping them automate debugging, suggest fixes, or generate reports by leveraging session data.
This article explores the key features of session recording tools through the lens of different development use cases and implementation scenarios, focusing on how developers can utilize full-stack session recording tools to enhance both individual and organizational workflows.
Summary of session recording tools’ must-have features by use case
The following table summarizes the session recording tool use cases we will explore in this article.
| Use case | Desired and must-have features |
|---|---|
| Understanding system behavior | Capture real-time usage, break down bugs, analyze test reports, and support root cause analysis (RCA) for user-reported and application issues. |
| Feature development | Enhance team collaboration by utilizing session recordings for design and performance validation. Annotate recordings to provide actionable feedback. |
| AI workflows | Feed session recordings to AI tools to generate insights and enhance debugging, code review, feature development, and design improvements. |
Traditional vs full-stack session recording
UX-centric session recording tools are widely recognized for their ability to provide user analytics by tracking DOM changes, click paths, and funnels, which are essential for teams analyzing product and user experience.
However, for developers working on complex, distributed systems, traditional session recording tools don’t provide the data needed to correlate frontend events to backend behavior. To address this gap, full-stack session recording tools are designed with developers in mind to capture critical data for debugging and feature development. This includes frontend actions, distributed traces, logs, request/response payloads, and header content.
How full-stack session recording tools correlate frontend and backend events
Full-stack session recorders go beyond DOM replay by producing a synchronized view of user interactions and system behavior through the following mechanisms:
- DOM mutation capture: Every user interaction, such as clicks, inputs, or visual updates, is captured as a DOM mutation, allowing developers to replay the exact UI state for analysis and debugging.
- Trace ID propagation: Each frontend action gets a unique trace ID that is passed through API requests, backend services, and database calls, linking the entire request flow across microservices. This makes it easier to trace backend failures or latency issues back to the originating user action.
- Unified timeline correlation: All interactions and requests in a session are aggregated into a single chronological timeline, aligning frontend events, network calls, and backend spans into a cohesive playback. This unified view simplifies debugging, as developers can move seamlessly from a UI event to the corresponding backend request or log.


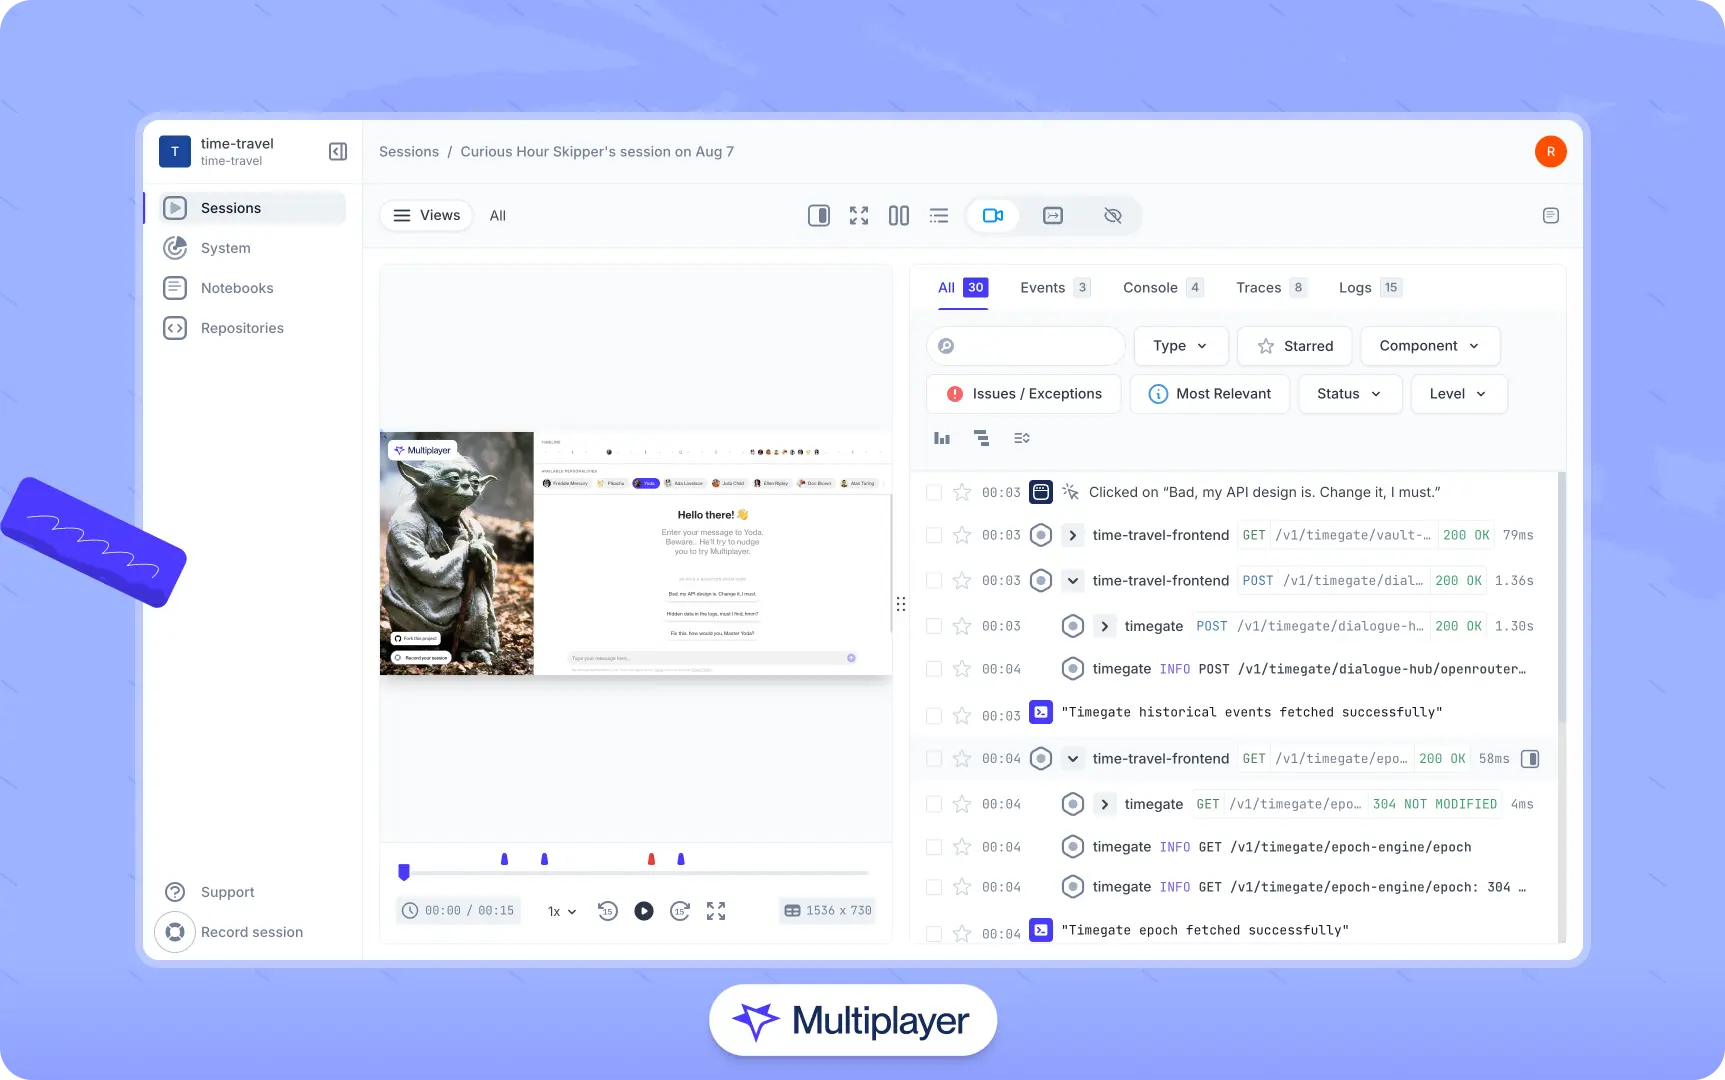
Full-stack session recording of an end-to-end user flow with frontend and backend events
Here are some other key features to look for in developer-centric session recording tools:
- Full-stack by default and backend-agnostic: Seamless integration with applications, providing a full-stack overview, without the need to instrument frontend and backend separately.
- Easy collaboration across teams: The ability to share recordings easily and collaborate through annotations, notes, and sketches can enhance the product lifecycle.
- AI-assisted debugging and development: Leveraging AI for error debugging, extracting insights from recordings, and supporting development directly within the IDE.
- Privacy and masking: Ensure the tool you choose includes robust privacy and masking controls, as these features help build customer trust and accelerate adoption.
Full-stack session recording
Learn moreEase of adoption
Another key factor to consider is how easily an engineering team can integrate a session recording tool into existing workflows. Developers often avoid tools that require heavy instrumentation or significant code changes, as they introduce complexity and slow down workflows. Modern session recording platforms address this by prioritizing minimal setup, automatic instrumentation, and backend-agnostic designs that work across a variety of architectures.
Many tools now offer simplified onboarding through browser extensions and lightweight SDKs, allowing teams to start capturing sessions without updating code across services. This reduces friction and makes it easier to evaluate a session recording tool’s value before committing to deeper integration.
Once a tool is selected, teams can ease the transition by gradually rolling out session recording. Start with key user flows, add valuable metadata to the sessions, and integrate recordings into areas where they provide the most value for your team, such as end-user technical support, bug RCA (root cause analysis), and QA reviews.
In the sections that follow, we explore how to utilize developer-centric session recording tools to understand system behavior, develop new features, and leverage recording data in AI-assisted development workflows.
Understanding system behavior
Modern applications have complex ecosystems in which dozens of components, services, and systems may interact with each other to serve a single user request. Identifying how a user action cascades across systems is often challenging, especially when debugging production issues.
With full-stack session recording capabilities, developers no longer need to debug manually by piecing together scattered logs or isolated traces. Full-stack session recording streamlines root cause analysis by providing a time-synchronized view of user actions, frontend events, API calls, backend services, database queries, and infrastructure usage on a single timeline.


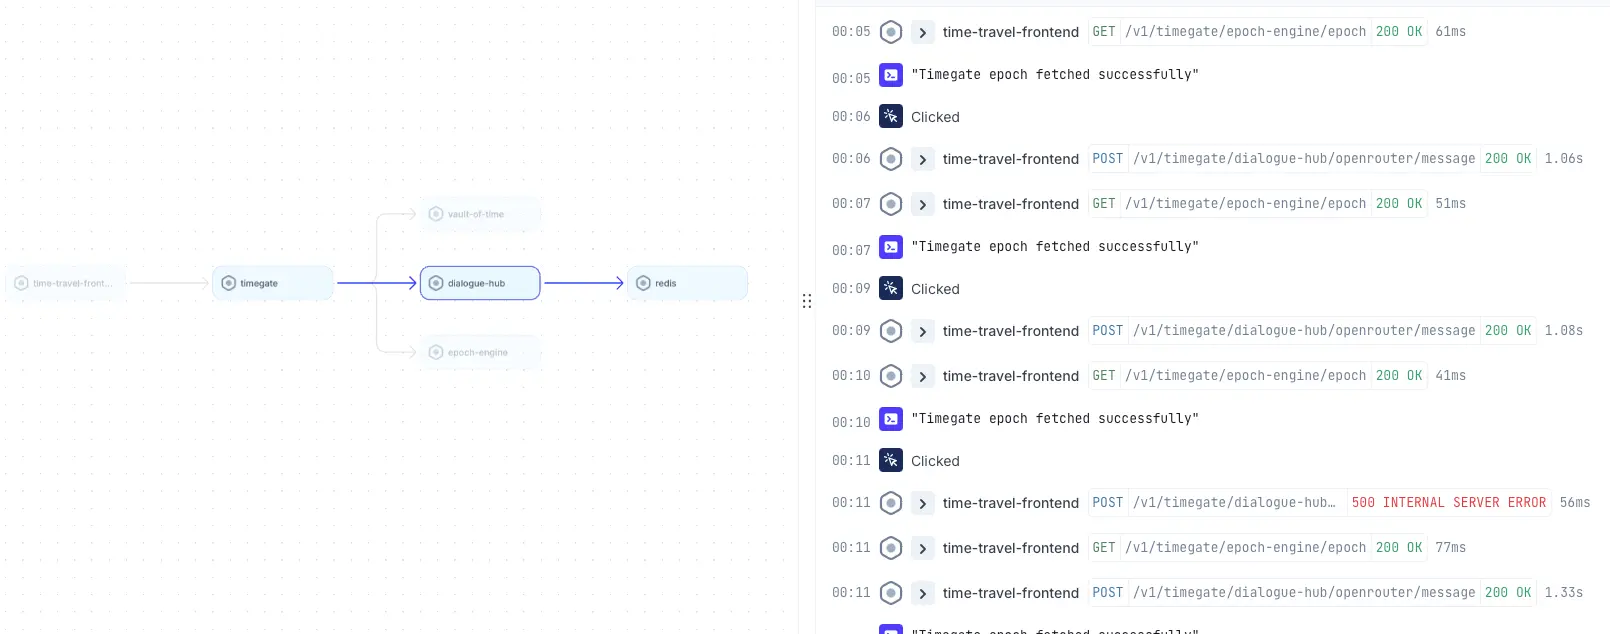
Example time-synchronized view of full-stack application behavior
Typical use cases where session recording helps developers better understand system behavior include:
- Spotting anomalies and patterns: Identify issues like race conditions, browser-specific slowdowns, or unstable API calls. Real-time capture also reveals transient problems such as memory leaks, timeouts, or behavior-triggered bugs that traditional debugging often overlooks.
- Detecting performance bottlenecks: Session recordings reveal real-world performance issues that synthetic tests often miss, such as API slowdowns under production load or with large datasets, database lag, frontend rendering issues, or region-specific latency. Session timelines make it easy for developers to spot these bottlenecks, as each request is associated with a timestamp, duration, and trace information.
- Identifying unusual patterns: Automated session recording enables proactive detection of unusual patterns, such as error spikes, repetitive user actions, deviations in user flows, or abnormal resource usage. Teams can set alerts on these anomalies to identify issues before users report them.
How session recording tools help developers
Full-stack session recording eliminates the guesswork in understanding system behavior, turning debugging into a proactive and data-driven process that improves both efficiency and product reliability. With the ability to capture sessions automatically and on demand, developers can leverage them to perform several essential tasks.
First, they can debug failures by analyzing the exact request/response details to identify anomalies such as incorrect data, missing parameters, authentication issues, or backend timeouts.
For example, here’s a full-stack session recording payload captured by Multiplayer:
{
        "component":"fetch",
        "http.method":"POST",
        "http.url":"https://test.execute-api.ap-south-1.amazonaws.com/prod/chat",
        "multiplayer.debug_session._id":"bb11889de1d0e62",
        "multiplayer.http.request.body":"{\"message\":\"hi\"}",
        "multiplayer.http.request.headers":{
                "traceparent":"00-debdebbb11889de1d0e6d2c87bc0e2a0-01",
                "Content-Type":"application/json",
                "Authorization":"auth_key"
                },
        "http.status_code":400,
        "http.status_text":"",
        "http.host":"test.execute-api.ap-south-1.amazonaws.com",
        "http.scheme":"https",
        "http.user_agent":"Mozilla/5.0 (Macintosh; Intel Mac OS X 10_15_7) AppleWebKit/537.36 (KHTML, like Gecko) Chrome/139.0.0.0 Safari/537.36",
        "multiplayer.http.response.body":{
                "message":"❌ An error occurred: Failed to parse JSON from Bedrock response: Unexpected non-whitespace character after JSON at position 52 (line 5 column 1)"
                },
        "multiplayer.http.response.headers":{},
        "http.response_content_length":0,
        "span.size":3054,
        "multiplayer.workspace.id":"67c5eeb07cec6c7851e1e",
        "multiplayer.project.id":"68dcef270f8aa72937da771",
        "multiplayer.session.id":"68dd7c3f0c6e866b42bec771"
}
Full-stack payload showing the request parameters, headers, and associated response
With this insight into the request headers, input payload, user agent, trace identifiers, and complete response body, developers can more easily pinpoint the failure without digging through scattered logs and traces.
In addition, developers can utilize the recording timeline to align frontend events with backend span and trace IDs, as shown in the example below:


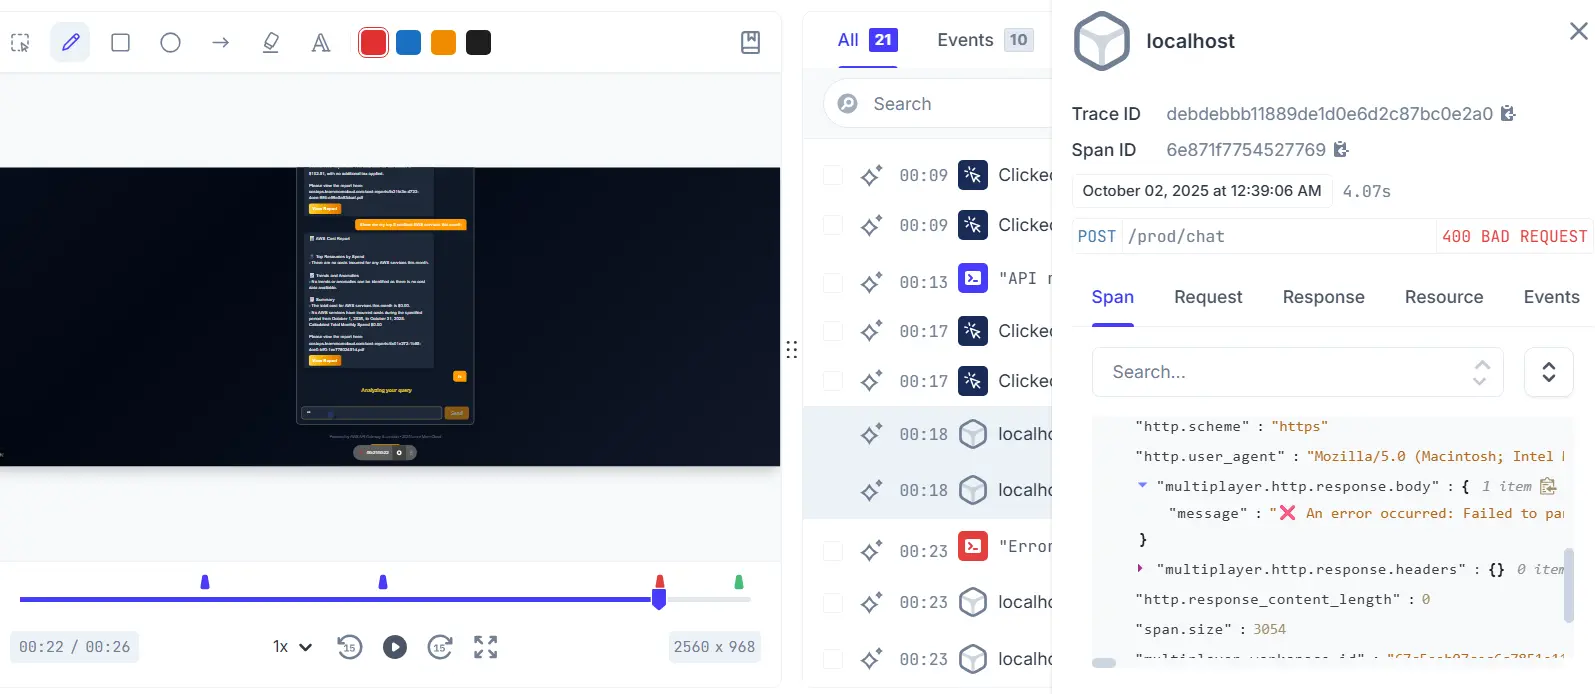
Time-synchronized view of a session highlighting the error timestamp
Finally, developers can filter and compare recordings by users, platform, and custom tags to isolate bugs. In doing so, they gain a better understanding of how issues manifest across different environments, enabling faster root-cause analysis and more resilient code improvements.
Record session replays that include everything from frontend screens to deep platform traces, metrics, and logs
Start For FreeHow session recording tools enable feature development
While session recordings are highly valuable for debugging application issues, they also accelerate feature development and enhance collaboration among development, QA, and product teams. Unlike static specifications or design mockups, session replays provide real-world context on how users actually interact with the application, serving as documentation for design intent and validation criteria.
For example, if a team were introducing a chat feature that supports message streaming, developers could use session recordings to validate that each frontend event correctly maps to backend behavior. A payload might look like this:
{
  "component": "fetch",
  "http.method": "POST",
  "http.url": "https://api.example.com/v1/chat/stream",
  "http.request.body": "{\"message\": \"Generate summary\"}",
  "http.status_code": 200,
  "trace_id": "bd29f10ea46d",
  "timeline": {
    "frontend.messageSent": "2025-11-10T14:02:31.115Z",
    "backend.chunkReceived": "2025-11-10T14:02:31.289Z",
    "frontend.messageRendered": "2025-11-10T14:02:31.310Z"
  }
}
Developers can use this data to inspect the end-to-end behavior of the new feature at a more granular level. For instance, they can verify that POST requests to /chat/stream are correctly triggered from the UI and use the frontend.messageSent, backend.chunkReceived, and frontend.messageRendered fields to measure latency and throughput.
Annotations
Tools like Multiplayer also allow developers to annotate recordings with sketches, on-screen text, and timestamp notes, so teams can attach precise feedback to the exact moment a behavior occurs. Session recording tools store annotations as timestamped metadata linked directly to the events in the session timeline.


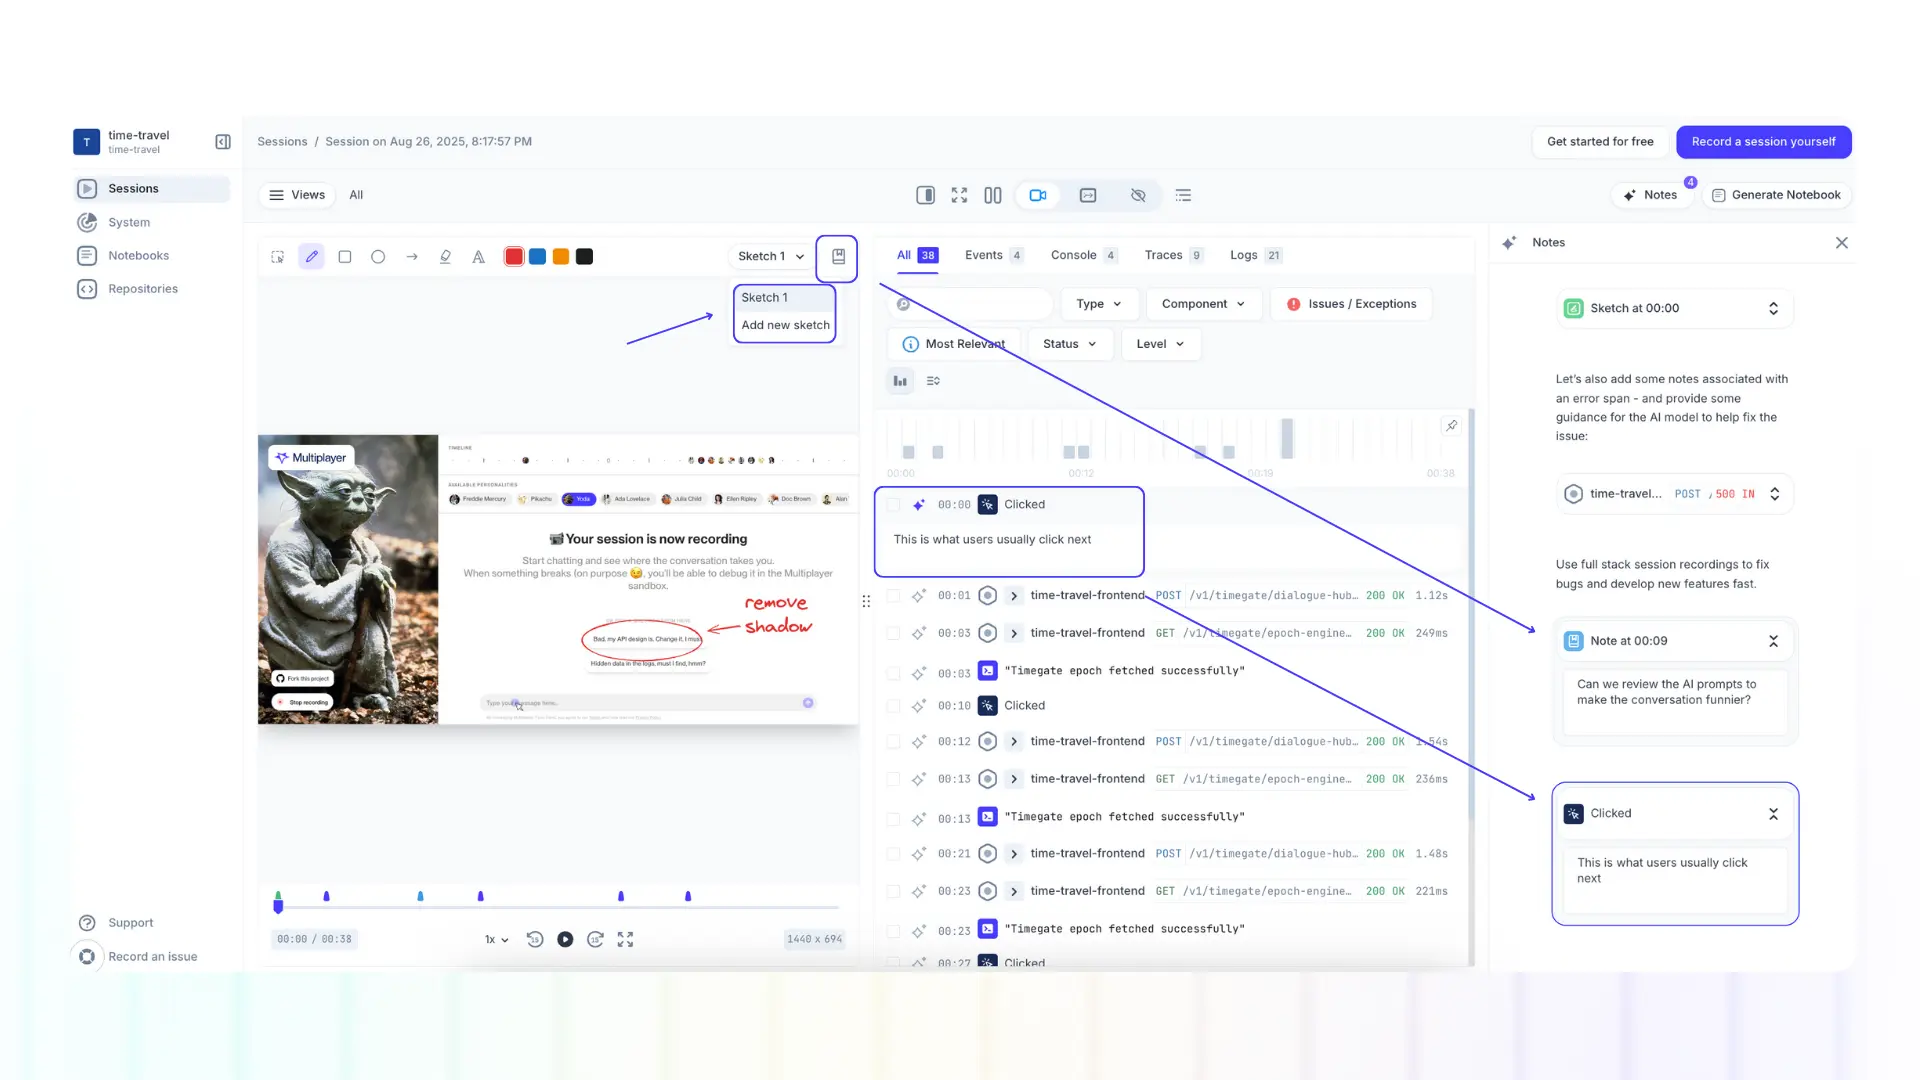
Multiplayer’s annotations feature set
These annotated recordings can then be linked to development tickets or tracked in ticket management systems, ensuring that feedback remains actionable and traceable. In addition, product managers can utilize annotated sessions as visual documentation for retrospectives, feature reviews, or roadmap discussions.
Integrating session recording tools and AI workflows
The integration of AI with session recording tools can facilitate seamless debugging, code review, feature development, and report generation. By analyzing rich, structured session data, AI can go beyond generic insights to deliver context-aware recommendations grounded in real application behavior.
AI for feature development
Leverage AI to provide usage-based suggestions from the application data for feature development or planning. Developers can feed AI copilots with the recording and contextual data via a Model Context Protocol (MCP) server to accelerate feature design and implementation. Through VS Code’s MCP protocol, the IDE can query session traces, annotations, and payloads in real time, enabling AI to generate design suggestions and code based on the session context.


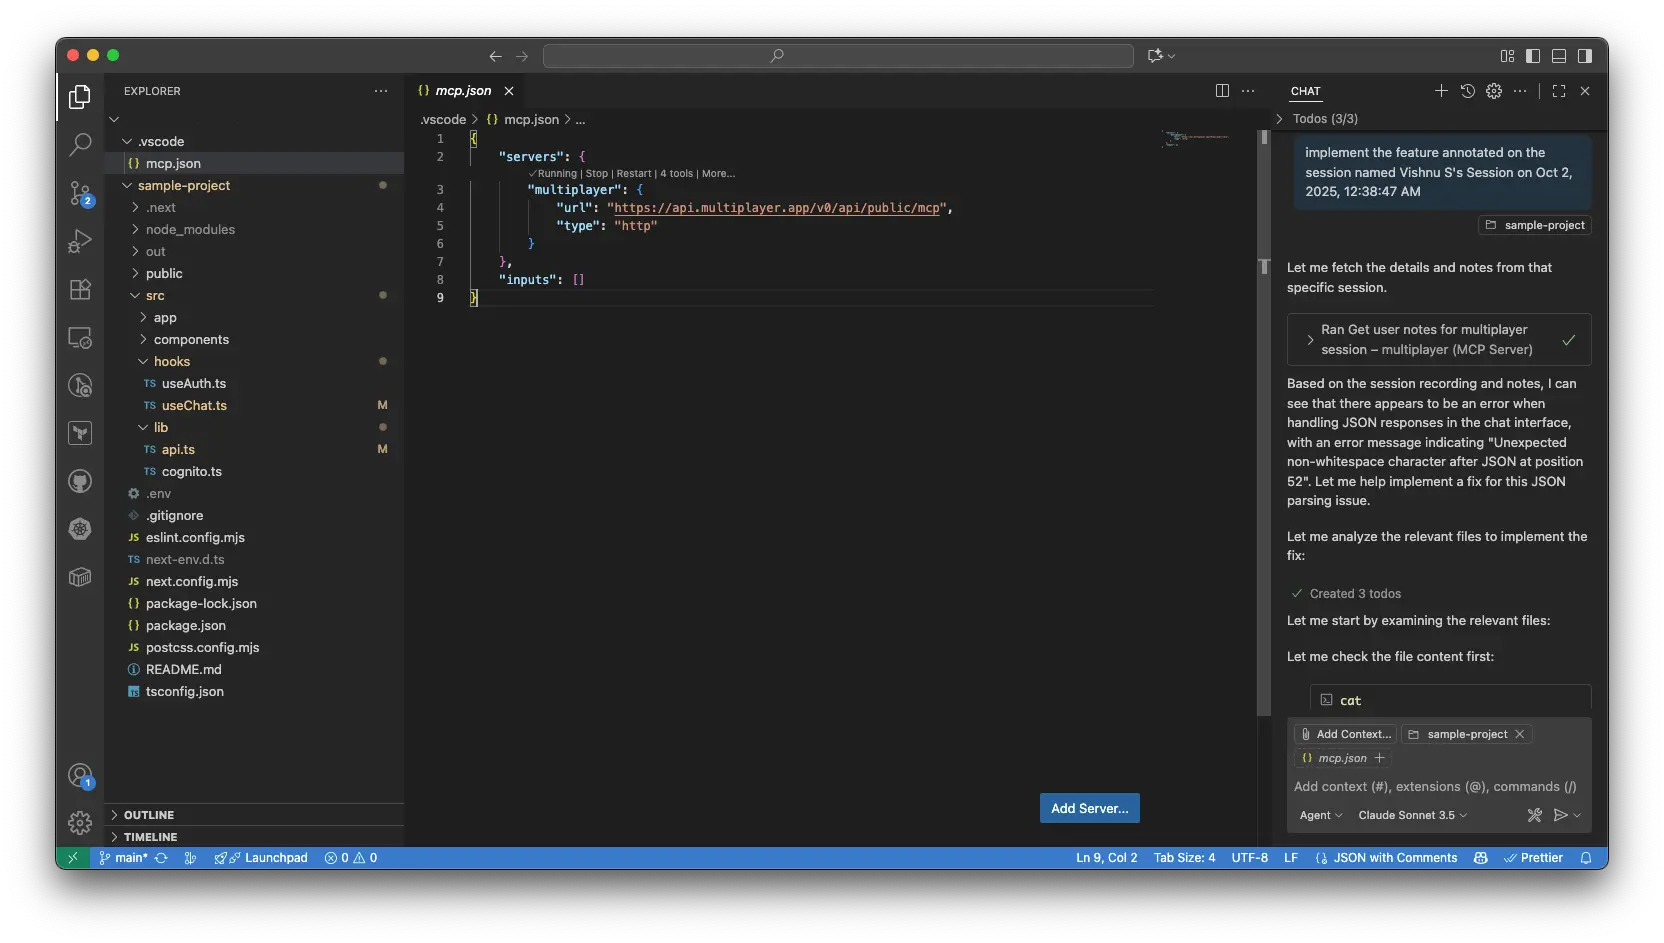
Implement features based on session annotations using AI
AI-assisted debugging
AI-assisted debugging helps developers save time by summarizing errors and analyzing the entire path of a user action from the UI event to the backend error from the session context. This eliminates the need to manually correlate logs and can also be used to generate reproducible test cases from the recorded payload.
With full payloads, stack traces, query metrics, and code context, AI assistants can deliver targeted fixes rather than generic suggestions.


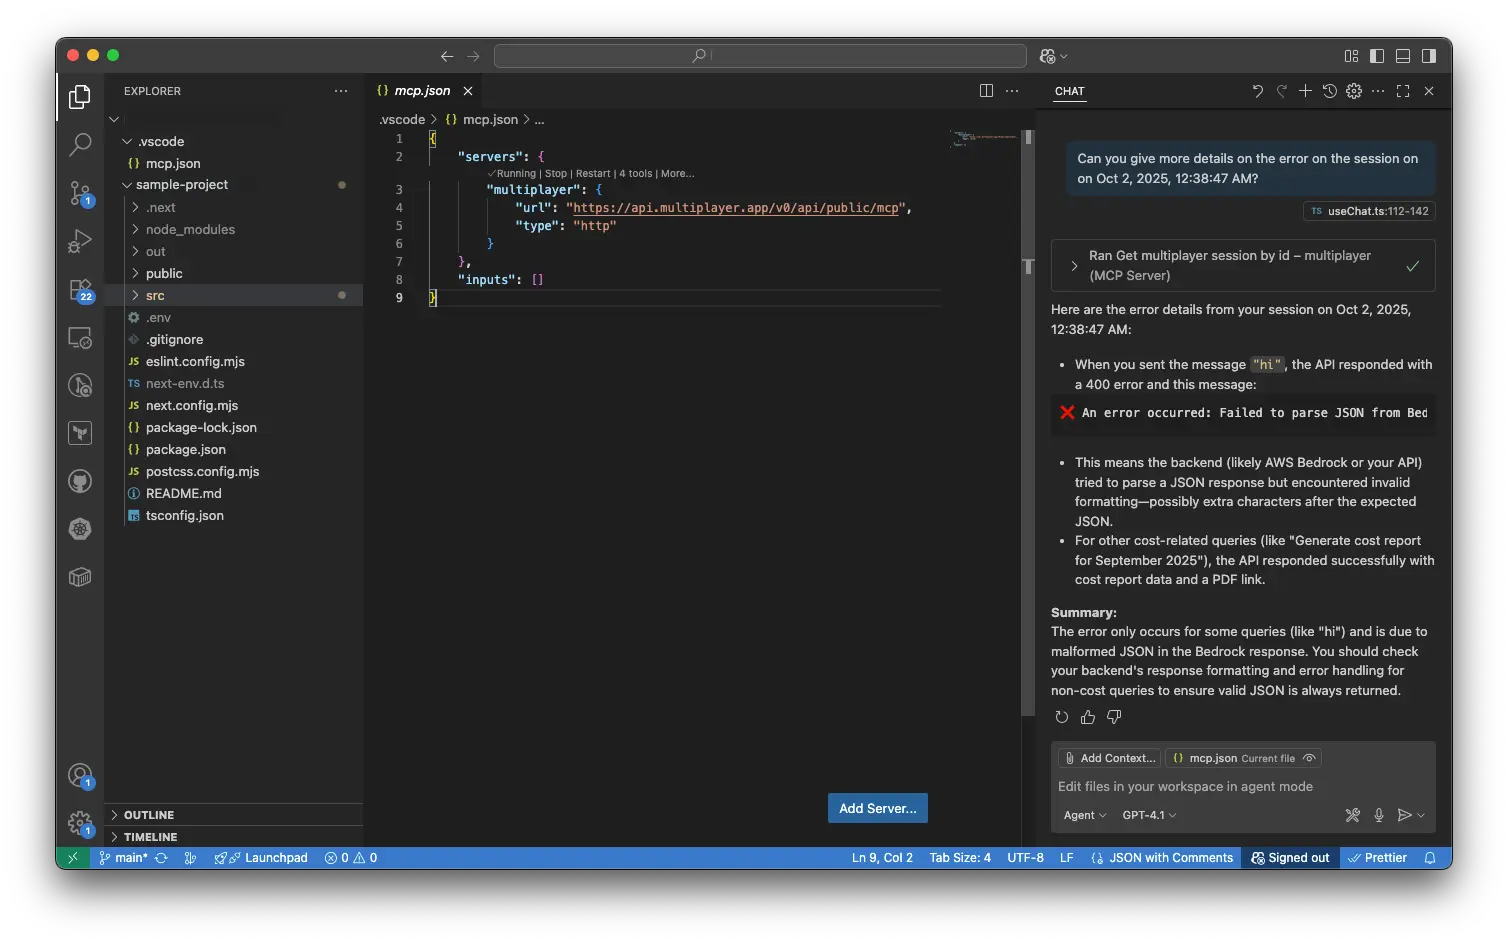
Utilize session recording to enhance AI-assisted debugging through MCPs
AI in code review
Perform code reviews using AI to identify patterns that can cause latency or inefficiency in production, detect sensitive data exposure in payloads or session traces, and flag the changes that could degrade rendering, query execution, or scalability based on prior production patterns.
For example, you can use AI to cross-check or implement a suggestion a senior developer has annotated in the recording.

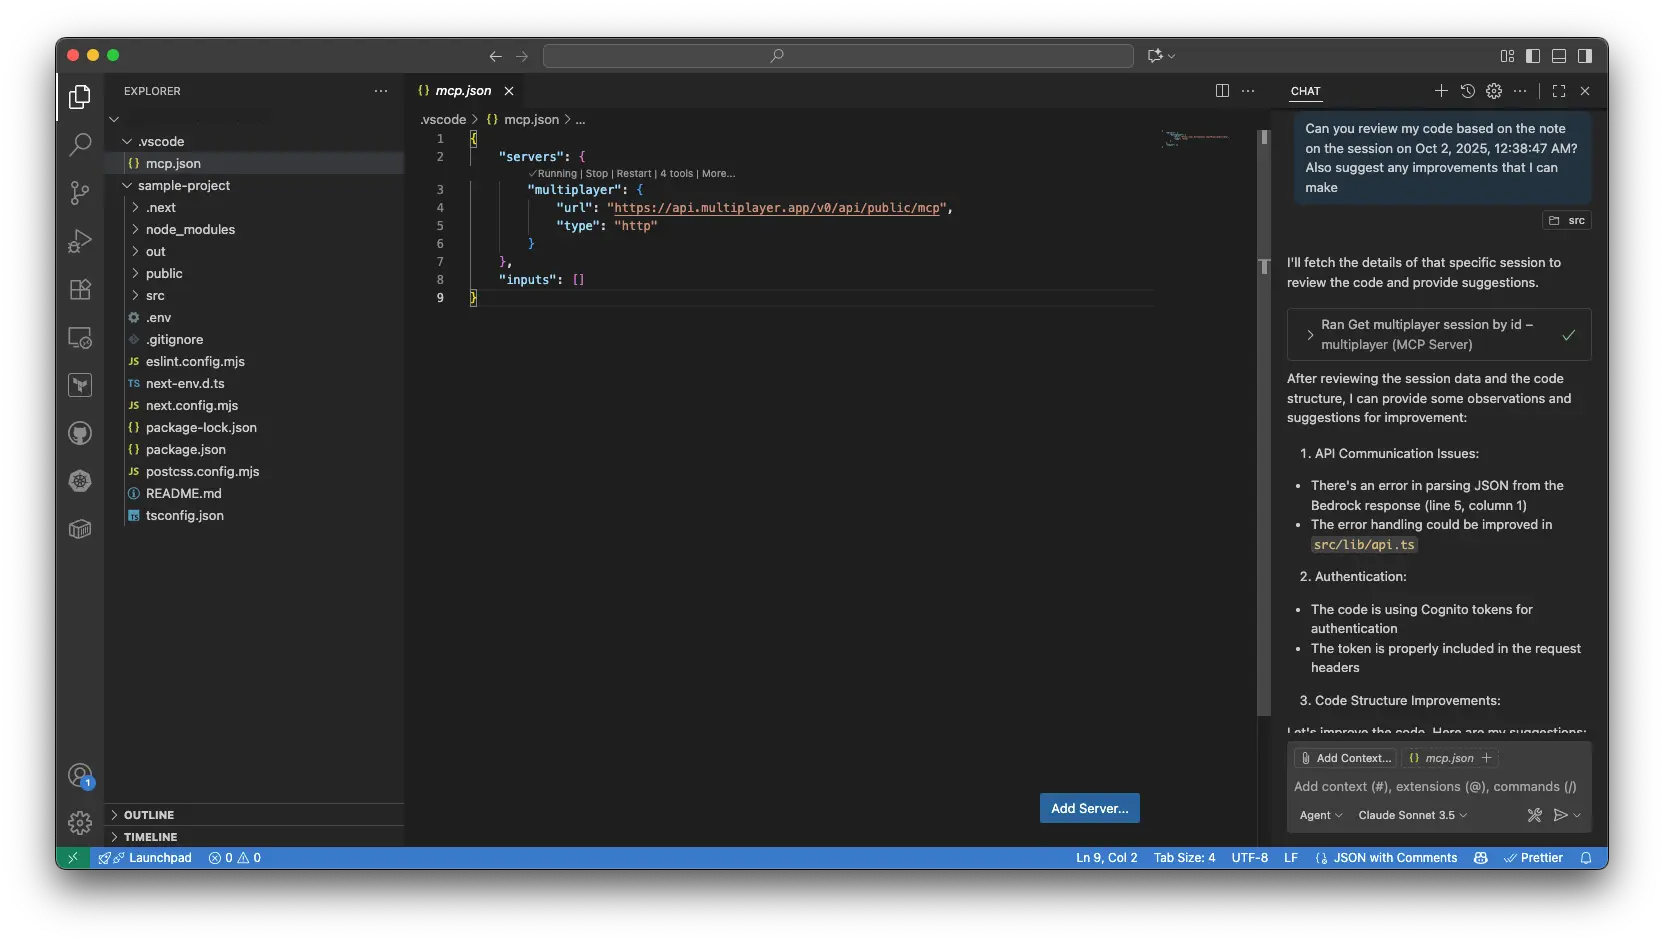
AI-assisted code review with session recording annotations and notes
AI for report generation
Use AI to generate a comprehensive report for your session recording, including breakdowns of API requests, user flows, performance events, and the session summary. Developers can use these reports to validate fixes by replaying the exact payloads and traces that caused an issue. At the same time, product teams can leverage them to communicate the root cause to the stakeholders or prepare retrospective summaries.
In addition, tools like Multiplayer leverage AI capabilities directly within the tool to generate executable development notebooks directly from a session recording. Notebooks are purpose-built for designing, testing, documenting, and debugging API integrations. They offer the following capabilities:
- Enriched text blocks
- Executable API blocks (similar to those provided by an API client)
- Executable code blocks (evaluated in a QuickJS runtime)
- Block sequencing (i.e., the payloads returned from API blocks can be used as inputs to code blocks, and vice versa)
- Version control

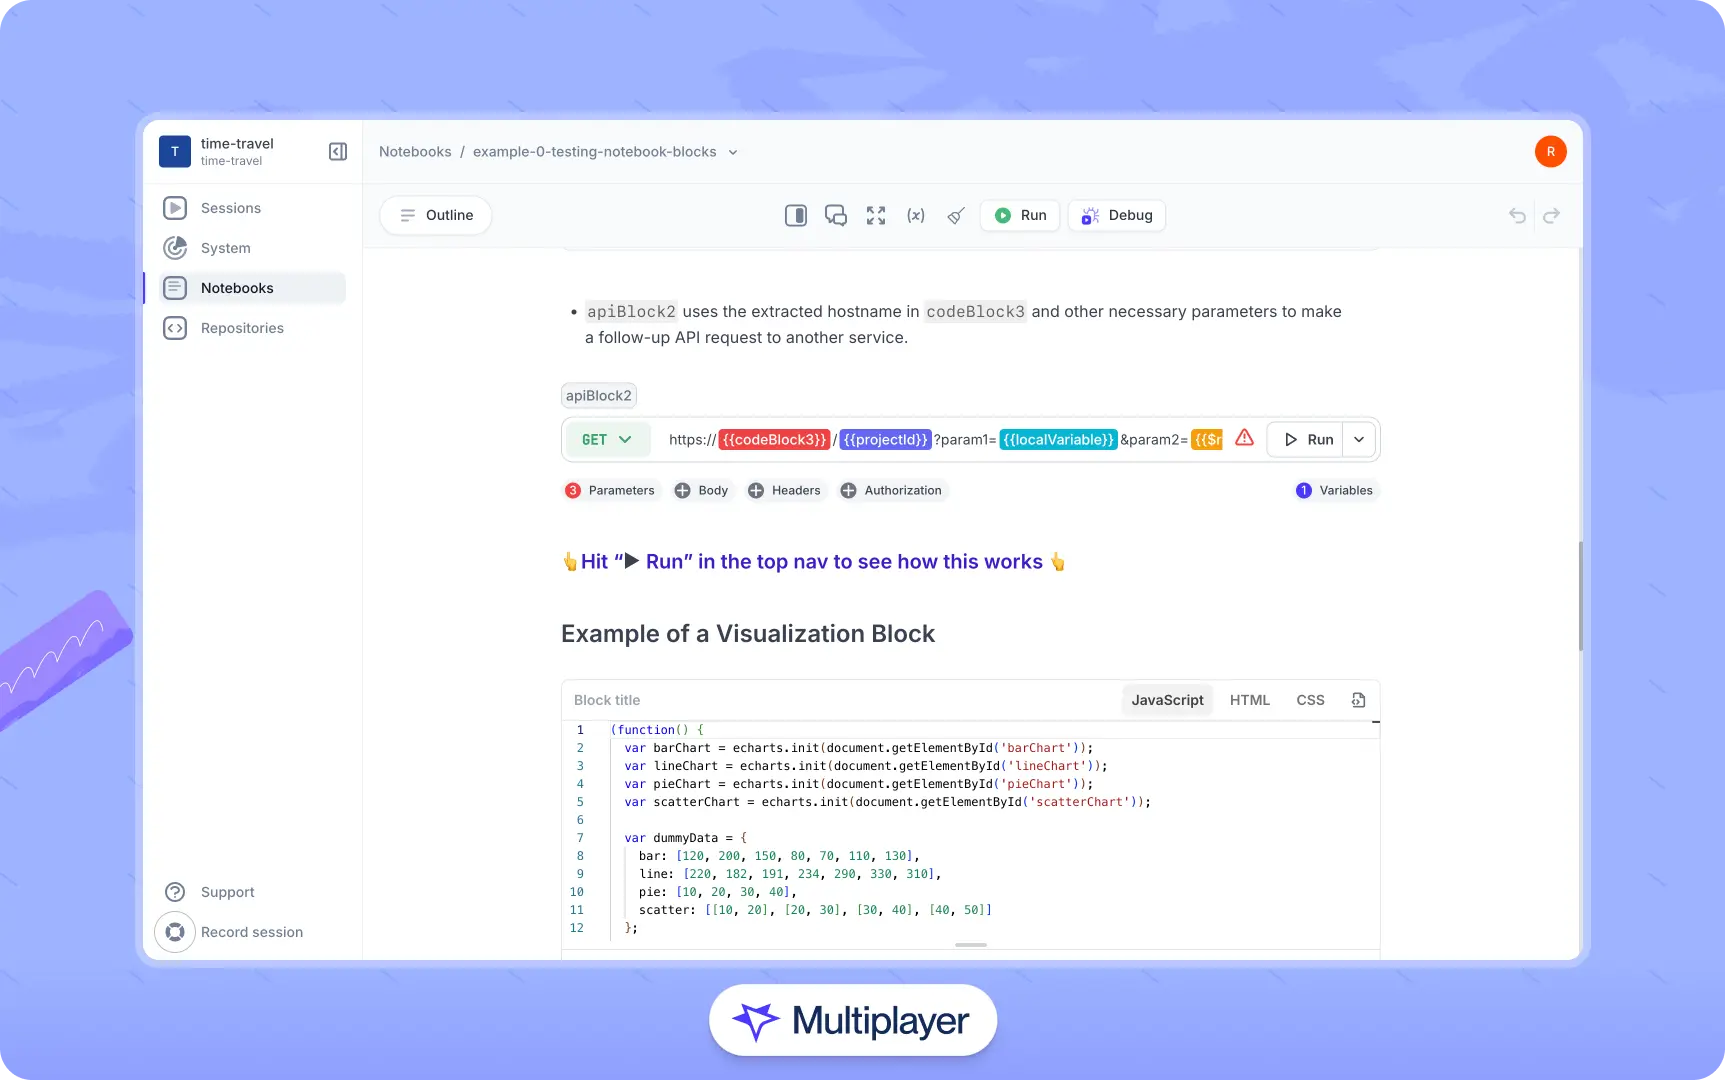
Multiplayer notebooks
Such a tool helps keep reports more closely tied to the live system. It allows artifacts such as system requirements docs, system design decisions, and architectural decision records to live alongside verifiable runtime behavior.
Conclusion
Modern session recording has evolved from marketing analytics into developer-focused platforms that capture full-stack behavior, enable seamless collaboration, and integrate with AI for debugging, testing, and feature development. What began as a way to understand user interactions now provides developers with clearer context and reduces the friction involved in identifying and reproducing issues.
As applications become more distributed and complex, AI-driven insights, predictive issue detection, and automated fixes will make session recording indispensable as both a debugging utility and a core observability layer for engineering teams. When added to existing workflows, it will help teams move a little faster, spot issues earlier, and base decisions on clearer evidence.