in minutes
Full-stack session recordings + debugging AI agent = precise, autonomous bug fixes
Is this how you fix a bug?
1 bug.
10 days.
5 departments.
No resolution.


Fix it with Multiplayer.
1 bug.
5 minutes.
1 person (or 1 AI debugging agent).
Resolved.


LOVED BY ENGINEERING TEAMS FROM STARTUPS TO ENTERPRISES


Capture what other tools miss with full stack session recordings
From complete frontend data to deep backend traces, logs, and full request/response content and headers for both internal services and external APIs.
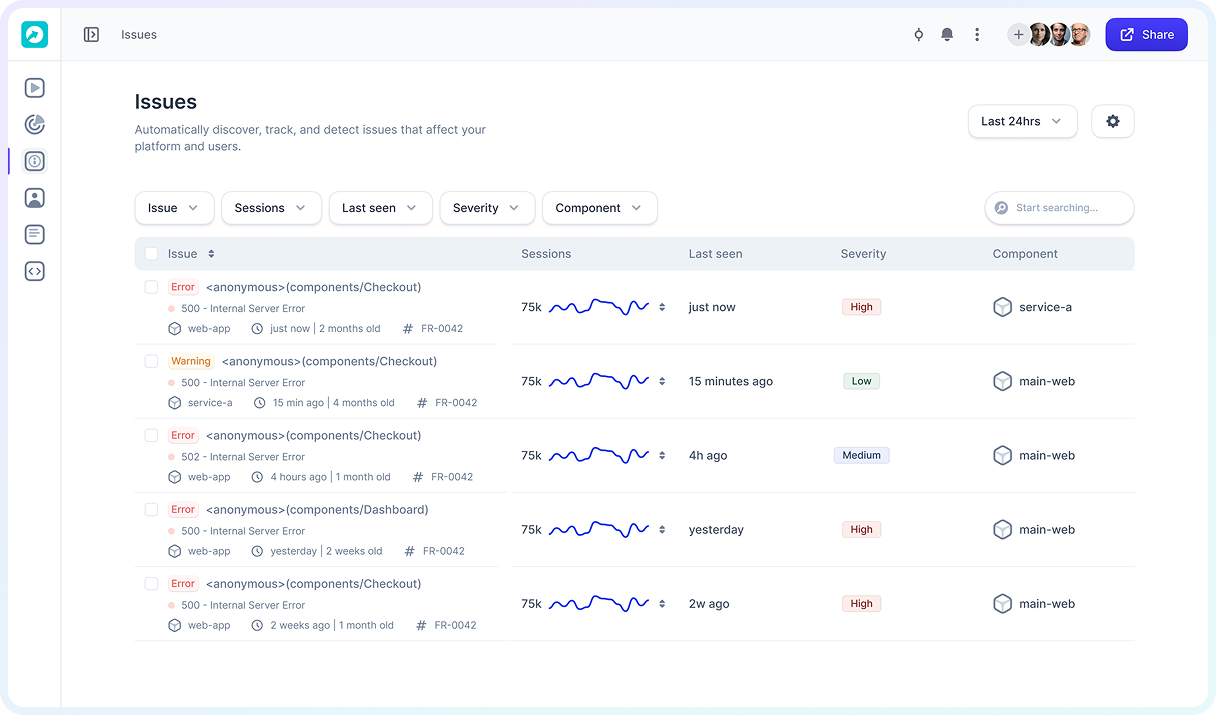
Everything automatically correlated, no sampling, no blind spots
Session-based observability that captures 100% of your system’s behavior auto-correlated with user interactions. Not data scattered across five tools or sampled traces that miss critical edge cases.
Understand the most complex bugs without repro steps
Intermittent failures, race conditions, cascading microservice errors and more all captured automatically. See exactly what happened across your entire distributed system, from code to UI.
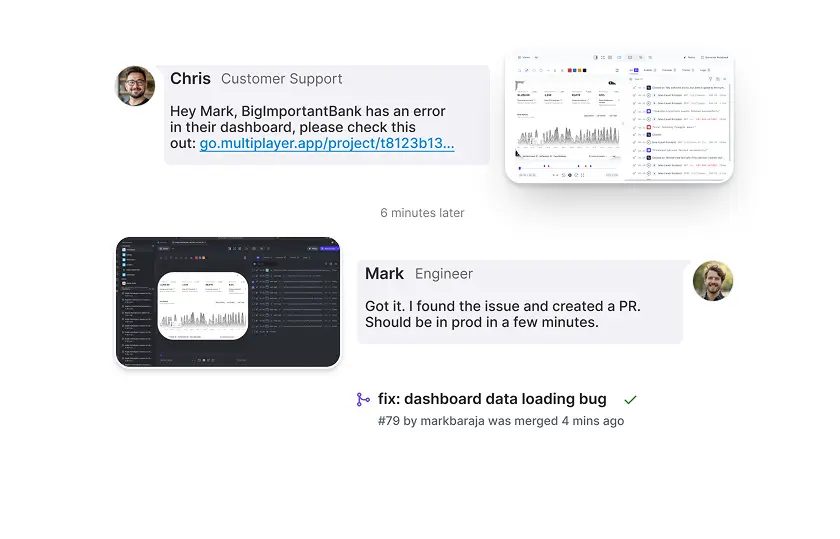
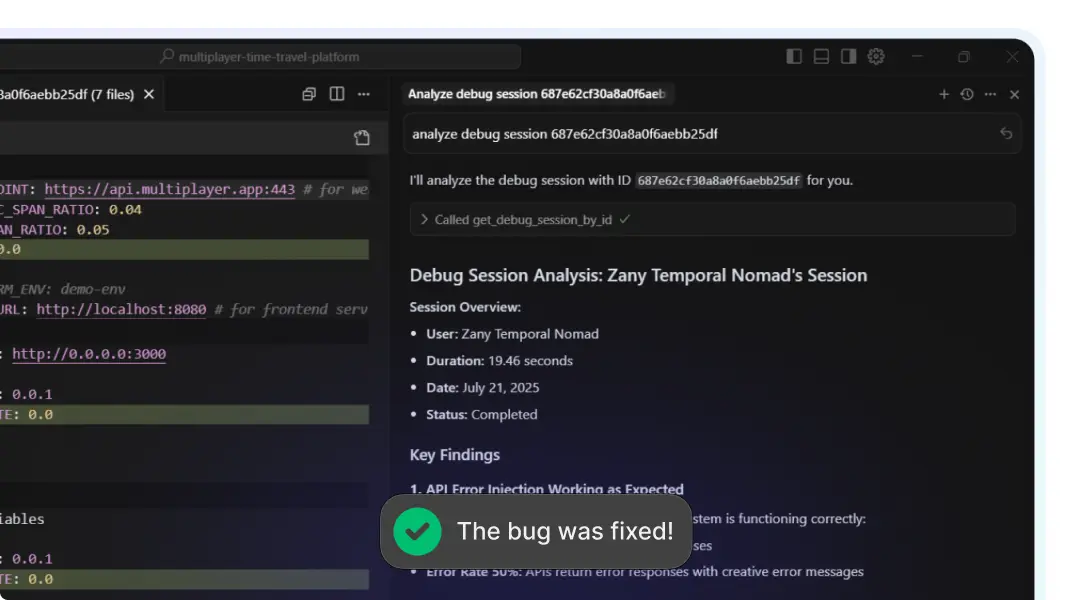
Automatically generate ready-to-approve PR fixes in minutes
Feed complete runtime context to your AI coding tools or use our autonomous AI agent. Either way, AI gets the actual data it needs to generate accurate fixes.
Fight vibe coded slop with complete runtime data
More AI-generated code means more bugs in production. Give your AI tools the exact session data, full payloads, and correlated traces they need to fix what they break, instead of guessing from incomplete logs.
Capture what other tools miss with full stack session recordings
Everything automatically correlated, no sampling, no blind spots
Understand the most complex bugs without repro steps
Automatically generate ready-to-approve PR fixes in minutes
Fight vibe coded slop with complete runtime data


Quickly solve the deeply technical issues that span services, teams, and tools


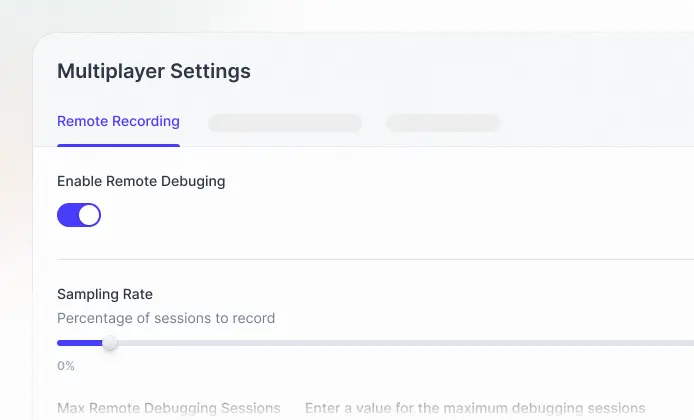
On-demand recording
Capture full stack session recordings on demand with a browser extension, in-app widget, or SDK. Developers, QA, product, support, and even external partners can instantly record and share issues, explore system behavior, and collaborate with sketches and annotations to fix bugs or design new features.

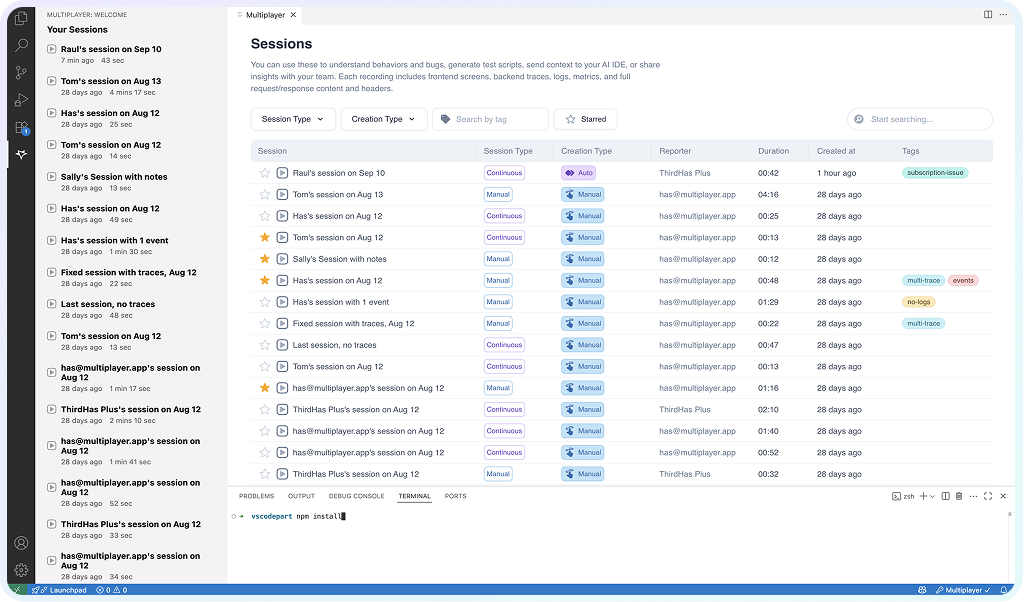
Continuous recording
Record all sessions automatically in the background, so reproducing issues is never required. Multiplayer saves recordings the moment bugs or anomalies occur making it effortless to capture elusive, hard-to-reproduce problems.

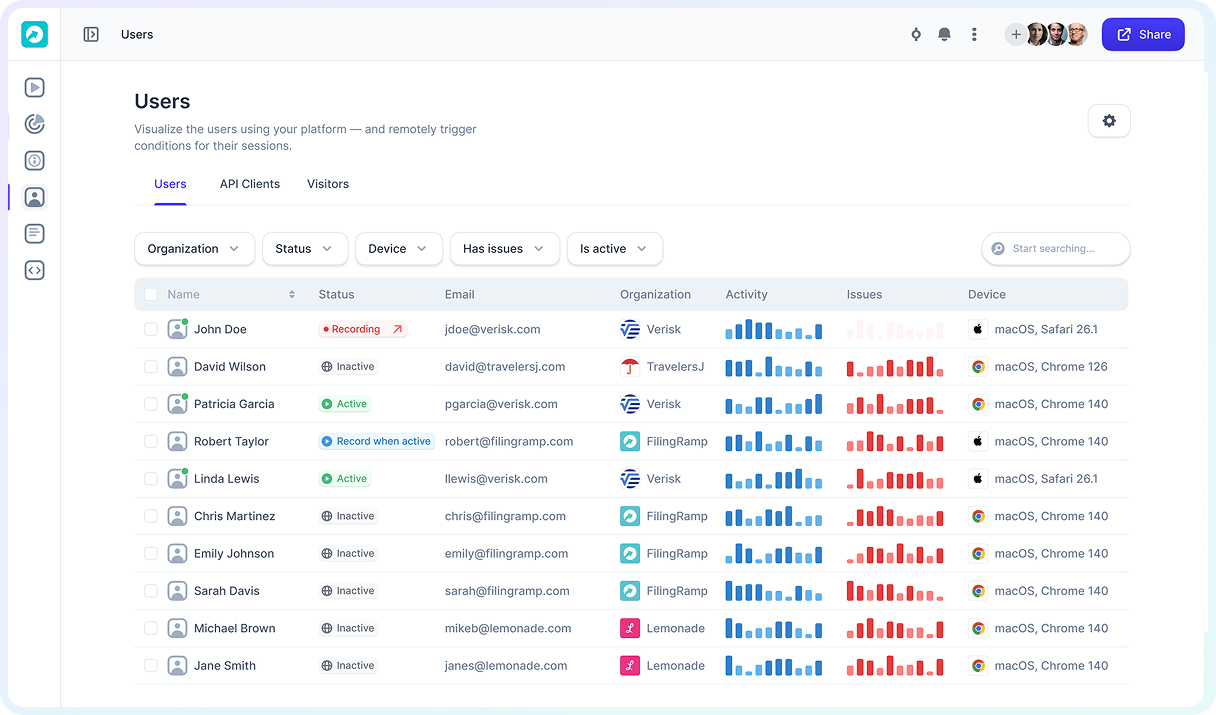
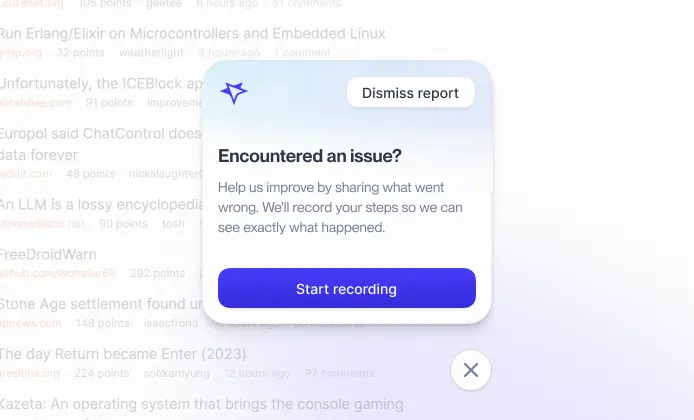
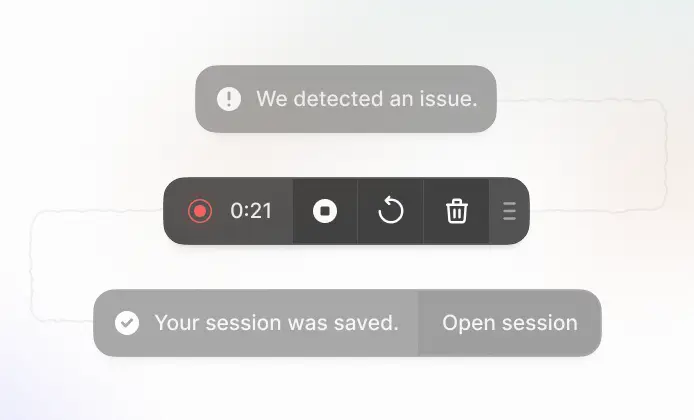
Conditional recording
Silently capture user sessions without any manual steps or bug reports. Multiplayer detects and records issues even when users don't notice or don't report them, giving your team complete context to resolve problems faster and avoid unclear, incomplete tickets.
From bug to fix. From idea to feature. Power all your AI workflows with full stack, annotated session replays.


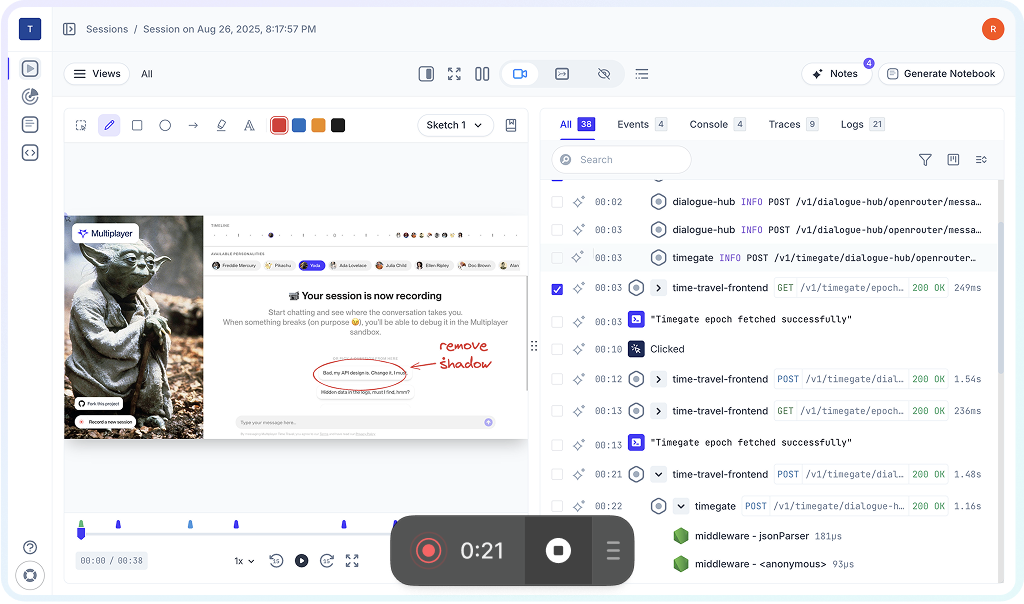
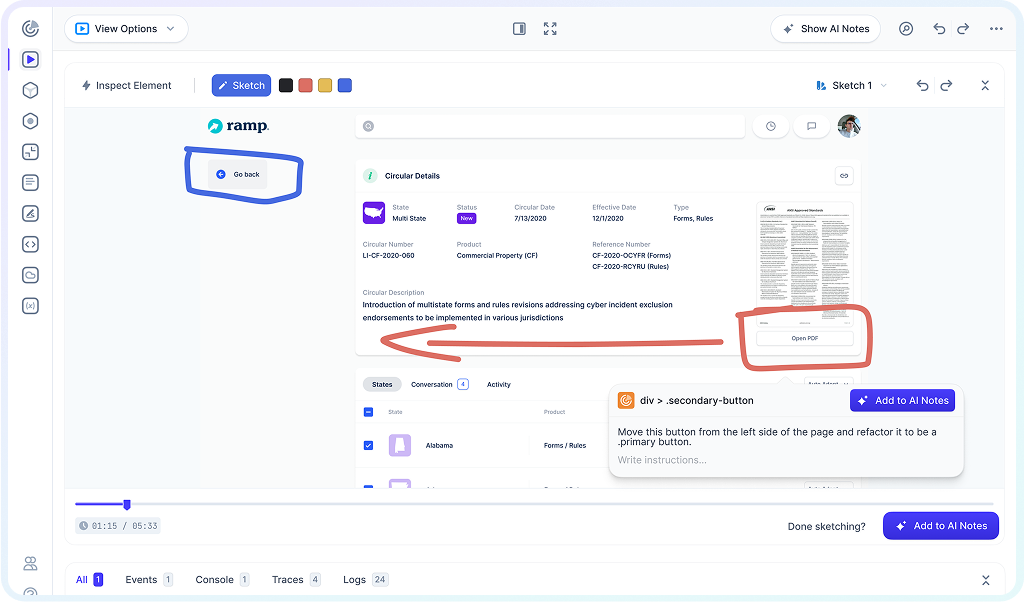
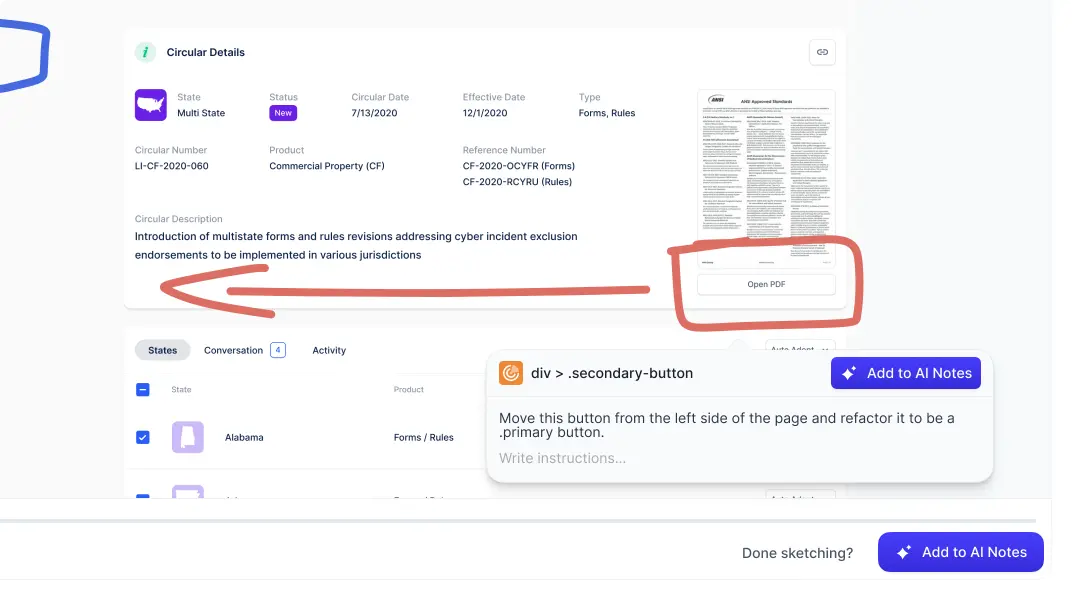
AI-ready annotated recordings
Turn session recordings into actionable development plans to share with your team or your AI coding assistant. Select traces, API calls, or user interactions, and annotate directly on screenshots: whether it's sketching over a button, specifying new API routes, or listing the reqs of new features. Every bug fix or feature request comes with precise, context-rich instructions.

MCP-ready full stack context
Feed your copilots and AI IDEs the complete system context they need: user actions, traces, logs, requests, responses, header data, plus team annotations. No missing data, no guesswork. Your AI tools can generate accurate fixes, tests, and features with minimal prompting.
Purpose-built for all engineering workflows
Feed the right data to your AI IDE
Build new features with confidence
Capture every issue, from customer apps to internal tools
Understand why your tests are failing
Share complete bug reports, effortlessly


Getting started with Multiplayer
is easy.
A simple, performant interface so you can start recording in minutes. It fits right into your code with SDKs for your favorite programming languages.
Get started with our client library
Install our Chrome Extension
Install our Visual Studio Code extension
You can install the Multiplayer Session Recorder using npm:
npm install @multiplayer-app/session-recorder-browserQuick start
import SessionRecorder from '@multiplayer-app/session-recorder-browser'

SessionRecorder.init({
  application: 'my-web-app',
  version: '1.0.0',
  environment: 'production',
  apiKey: 'MULTIPLAYER_API_KEY',
})
More languages and CLI SDKs can be found in our documentation.
Our solution works with your favorite tools
Connect Multiplayer with your favorite tools to streamline your workflow and improve your team's productivity.
 OpenTelemetry
 Honeycomb
 New Relic
 DataDog
 SigNoz
 GitHub
 GitLab
 BitBucket
 JavaScript
 Node.js
 Python
 Java
Java .NET
.NET Go
Go Ruby
Ruby PHP
PHP Rust
Rust Swift
Swift React Native
 VS Code
 Cursor
 Claude & Claude Code
 Windsurf IDE
 Zed
Zed Codex CLI


Book a call with us and
get up and running right away.
Schedule a call with our team to see all of our features and explore if Multiplayer is right for you.
Book a demo