The death of the dashboard: why agentic AI is choking on legacy observability tools
Dashboards, sampling, and data lakes were built for human debugging. Closing the bug-to-fix loop for AI agents requires rethinking how runtime data is collected and correlated.

Observability as we know it is on its way out.
For over a decade, we built telemetry stacks around a single consumer: a human, staring at a dashboard, trying to make sense of a system under stress. Every architectural decision that followed (sampling, aggregation, retention limits) was optimized for that consumer, forcing us to throw away a large portion of our data just to keep costs down and dashboards readable.
That tradeoff made sense when a person was doing the looking. It stops making sense the moment an agent is.
Autonomous AI agents are increasingly the ones detecting issues, investigating root causes, and shipping fixes. And they're drowning in exactly the data we spent a decade optimizing for human eyes: telemetry collected by casting the widest possible net, then sampled and aggregated down to whatever a dashboard could display.
The result is a system drowning in data and starving for signal.
This article makes the case for why the observability data we collect today fails agents, and what a runtime architecture built for this new consumer actually looks like.
We ship code (and bugs) faster than ever
Teams using coding agents are shipping faster: more code, more changes, more features, without growing the team. But the same data shows the other side. More bugs per developer. More incidents per PR. More risk in the code AI writes.
Velocity up, stability down. Both true at the same time. Recent research converges on the same conclusion:
- DX's AI-assisted engineering report: Some companies are increasing the Change Failure Rate (CFR) value by almost 2%. Given an industry benchmark of 4%, this means some companies are shipping up to 50% more defects than before.
- Sonar's State of Code Developer Survey: 96% of developers working with coding agents don't fully trust that AI-generated code (42% of all committed code) is functionally correct. Yet 48% are regularly shipping code they haven't fully verified.
- Aikido Security's State of AI in Security & Development report: AI-generated code is responsible for roughly one in five security vulnerabilities discovered.
- Apiiro's research inside Fortune 50 enterprises: AI coding assistants can be up to four times faster than humans working alone, but the code they ship carries ten times the risk.
- Faros's AI Engineering Report: incidents per PR are up by 242%, monthly incidents are up 58%, bugs per developer are up 54%, bugs per PR are up 29%.
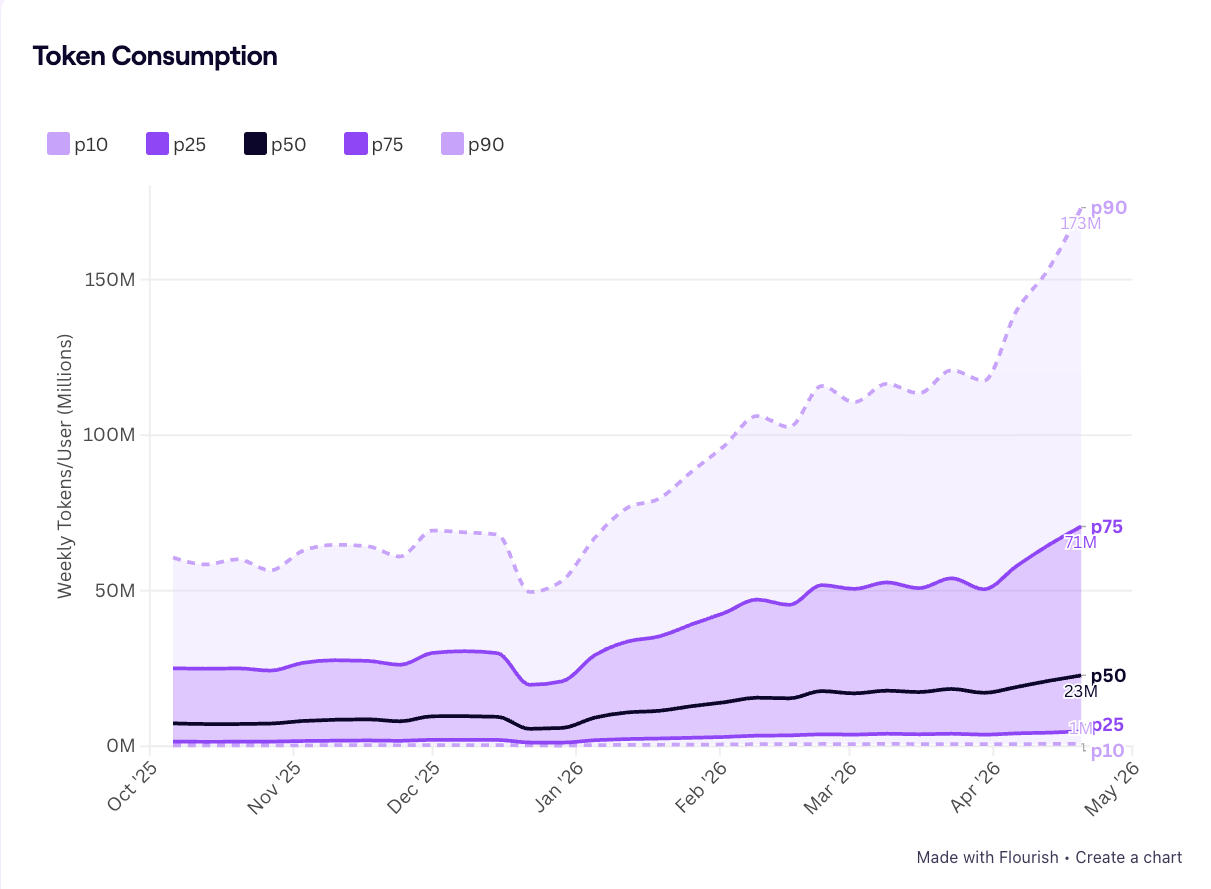
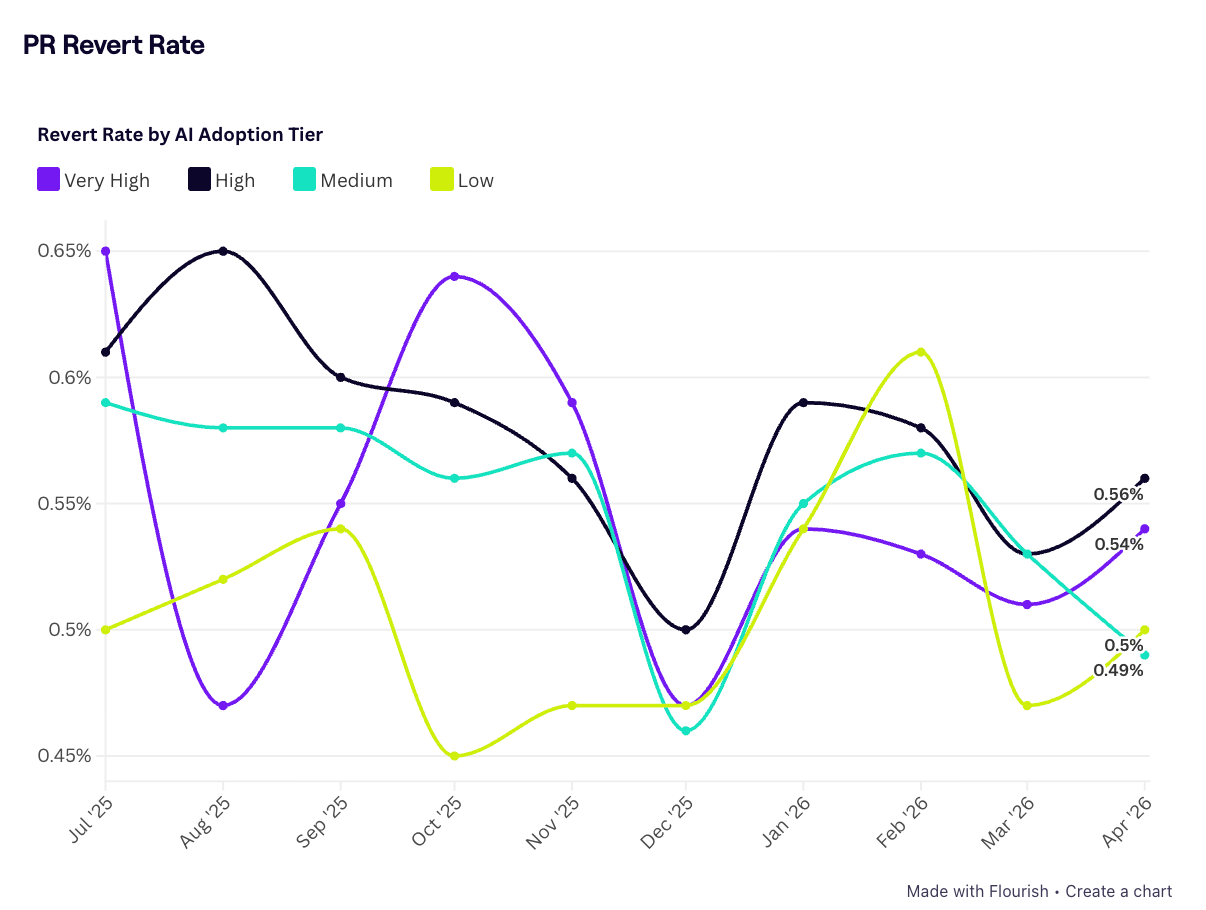
And in case there was any doubt, the latest Jellyfish's AI Engineering Trends research shows token consumption climbing sharply (P90 is now 173M weekly tokens per user as of May 2026), but PR revert rates haven't followed. They remain roughly flat across all AI adoption tiers, hovering in the same 0.45%–0.65% band they were in a year ago. More tokens per developer hasn't bought fewer reverted PRs.
Why human-optimized data creates friction for AI
Historically, observability data has required practical compromises to manage storage costs and prevent human cognitive overload. These were sensible, rational engineering choices for teams of human operators with finite attention spans and budgets.
Those compromises made sense for their intended audience. They're also exactly why this data is such a poor fit for an agent's context window.
Here are six reasons the observability data you're already collecting was never built for an agent.
1. Volume
Most telemetry collection is preventative. Teams collect everything because they don't know in advance what they'll need when something breaks, and instrumenting after the fact, once a gap is exposed, is slow and expensive. So the default is to cast the widest possible net.
Casting a wide net and catching the right fish, however, are different problems. The result is organizations sitting on enormous volumes of generic telemetry, wrestling with the storage bill that comes with it, and, for agents, burning through a context window before they've even gotten to the question.
Paradoxically, OpenTelemetry made this worse, not better. Democratized instrumentation is genuinely good for standardization, but it also made it trivial for every team to auto-instrument everything, and most do, without anyone asking whether the data is useful. The result is a system drowning in telemetry and starving for signal. As Michele Mancioppi, head of product at Dash0, put it on a recent LeadDev panel: "[…] of the logs getting into observability tools, less than 1% are fatal errors. All the rest is probably a waste of money."
2. Sampling
Sampling gives you a representative picture of system behavior at a fraction of the cost. For a human looking for patterns across millions of events, that tradeoff is reasonable. For an agent trying to reconstruct one specific failure across service boundaries, it's close to useless: the agent can't reason over the gaps. Indeed, it has no way of knowing the gaps are even there.
3. Aggregation
A p99 latency metric is more useful to a human scanning a dashboard than a million raw data points would be. But an agent debugging a specific failure needs the individual events, in order, with full payloads. Averages can obscure the outlier that caused the bug (and, sometimes, they erase it entirely).
4. Data that was never collected
Request/response payloads aren’t captured by default due to privacy and cost concerns. You can see that an API call was made, but not what data was sent or what came back. Headers (authentication tokens, routing info, custom metadata) are often redacted for security reasons, removing critical debugging context. External API exchanges are black boxes. Distributed tracing stops at your system boundary. When your backend calls Stripe, Twilio, or AWS, you see the call happened and how long it took, but not what you sent them or what they returned.
5. Siloed collection
DevOps and platform engineering were supposed to be the industry's answer to this. Break down the wall between different teams, frontend and backend, and the silos go with it.
In practice, not all silos have disappeared, especially in larger organizations. Frontend errors still live in one tool, backend traces in another, and the correlation between them still lives in tribal knowledge: developers know how to correlate a user click at 14:32:01 to the cascade that showed up in the backend logs at 14:32:04.
An agent has no such intuition. In theory, it could query every tool separately and correlate the results itself. In practice, this rarely works: each platform has its own APIs, auth, and data formats, and the correlation keys that tie events together (request IDs, trace IDs, session IDs) rarely propagate across tool boundaries. The agent is left guessing which frontend error maps to which backend trace based on timestamps alone, an approach that falls apart under any real load or clock skew. Even with perfect access to every tool, the agent can't reconstruct the full picture unless the data was correlated at the point of collection.
6. Metadata inconsistency
This is the gap humans paper over without noticing. Everyone on the team eventually learns that "payment-service," "svc-payments," and "payments_v2" are the same thing. It comes up in a Slack thread, gets mentioned during onboarding, and lives in someone's head from then on. An agent has none of that. It sees three different entities, because as far as it's concerned, that's exactly what they are.
Stop bolting AI onto the interface. Fix the data underneath it.
None of the practices described above were mistakes. They were the right calls for an era of human-led debugging. But you can't ask an agent to debug a system when the exact data it needs was sampled out or discarded to save on storage.
The Jellyfish data makes the point cleanly: you can't fix a data problem with more compute. If more tokens and better models produce the same PR quality as before, the bottleneck was never compute to begin with.
The industry spent years solving for open-loop observability: helping humans detect problems through dashboards and alerts, which would then be fixed (closing the loop) in another tool, with another workflow. In the past year, every major platform bolted on an AI agent or an MCP server and declared the bug-to-fix loop closed: "We don't just detect issues, we fix them."
These integrations offer real value, and they do speed up workflows. But connecting an agent to your observability stack isn't the same as giving it what it needs to fix something.
An agent's capabilities are fundamentally bound by the system underneath it. If a trace was sampled out or a payload was dropped at collection time, no amount of agent intelligence on top can recover it. The data simply isn't there to analyze.
Closing the loop isn't an integration problem. It's a data problem, and it requires an architectural shift in how runtime signals are captured, retained, and correlated.
Flip the question
Most teams are asking: how do I give my AI agent access to my telemetry?
That's the wrong question.
The right one is: what does this agent actually need to fix what's broken?
The two are not the same. Access to a platform built for a different consumer doesn't make the data inside it any more complete. To understand if your observability data is ready for autonomous agents, ask yourself:
1. Does the agent get the exact, unbroken session, or a sampled trace with gaps it can't see?
2. Is data correlated across service boundaries at the point of collection or is the agent matching timestamps and guessing?
3. Can the agent see real request and response payloads including calls to third parties like Stripe, Twilio, or AWS?
4. Does the agent receive a deduplicated, scoped issue or a raw stream of telemetry it has to make sense of first?
5. Is the agent positioned to act (producing a fix, ranked by severity, ready for review) or only to summarize and page a human?
If the answer to most of these is no, the gap isn't in your agent. It's in everything the agent is standing on.
The dashboard is dying because the questions worth asking have changed, and dashboards were never built to answer the new ones. The teams that can effectively leverage all the potential presented by AI agents will be the ones whose runtime data was ready for them.
Run it locally, for free👇