Don’t lose the trace that matters: Multiplayer’s zero-sampling approach
Multiplayer is the only session recorder that combines frontend replays with unsampled backend traces, stitched together automatically. You don’t have to choose between drowning in noise or missing the critical data.


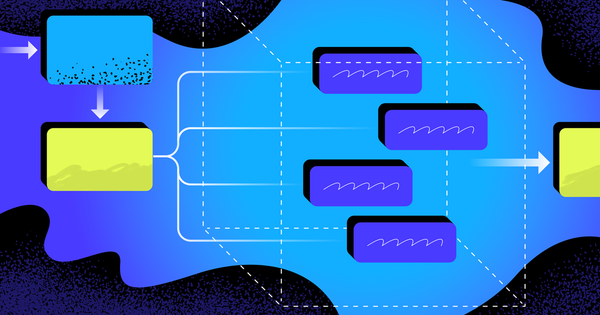
Backend tracing is the backbone of understanding how modern distributed systems behave. Each request generates a chain of spans as it travels through your services and components: what happened, how long it took, and whether it failed. Stitch those spans together, and you get a trace: the full story of a request from start to finish.
That’s the theory. In practice, most tools only give you part of the story.
The problem with sampling in APM tools
APM platforms ingest massive volumes of telemetry, and to keep costs under control they sample aggressively: only a fraction of traces are kept. That works fine for monitoring overall trends and system health, but it breaks down when you need to debug a specific issue or bug.
You can easily miss the trace that actually matters, or waste hours stitching it together from fragments.
I talked about this in our recent webinar, How left-shifted observability speeds up debugging. In short, teams often fall into a vicious cycle:
- You spend a large share of your budget collecting telemetry, but most of it sits unused.
- To cut costs, you reduce tool sprawl or turn to pre-aggregation and trace sampling.
- Inevitably, you lose the detail that makes debugging possible or you burn engineering hours trying to balance “enough detail” against “not going bankrupt.”
Why Session replay tools don't fix it either
If APM tools sample away the traces you need, session replay might seems like the answer with their targeted approach. However, most stop at the frontend. They show you what users clicked and where they got stuck, but not why your application behaved that way.
The tools that claim "full-stack visibility" typically work in one of two broken ways: they either piggyback on your existing APM (inheriting its aggressive sampling or lack of deeper information such as request/response payloads from internal service calls), or they require brittle manual instrumentation where you're responsible for capturing and correlating API calls, traces, and errors yourself.
Either way, you're still missing the technical context when debugging. You see the user encountered an error, but the API trace that explains why was sampled away or never captured at all.
How Multiplayer does it differently
When you start a session recording in Multiplayer, we capture every backend trace connected to that session, with zero sampling.
Here’s what happens under the hood:
- Multiplayer generates a unique trace context for the session (trace ID + span IDs). In OpenTelemetry terms, this is a
TraceContextthat travels with requests as they flow through your system. - In OpenTelemetry, each trace has a
traceFlagsfield, which includes a sampling bit (often called the “sampled” flag). Normally, your observability platform has a cardinality threshold based on which it decides whether to sample (keep) a trace or drop it. Multiplayer sets the sampled flag totrueat the root span, so all spans in the trace are preserved. In short, for each session we keep everything. - As the request travels across services and components, OpenTelemetry propagates the trace context via headers (
traceparent,x-trace-id,x-span-id, etc.). Every service that participates in the session inherits the “sampled = true” flag, ensuring that no span gets dropped along the path. - OpenTelemetry SDKs and collectors gather all spans, logs, and metrics. Review our backend configuration step for customization options.
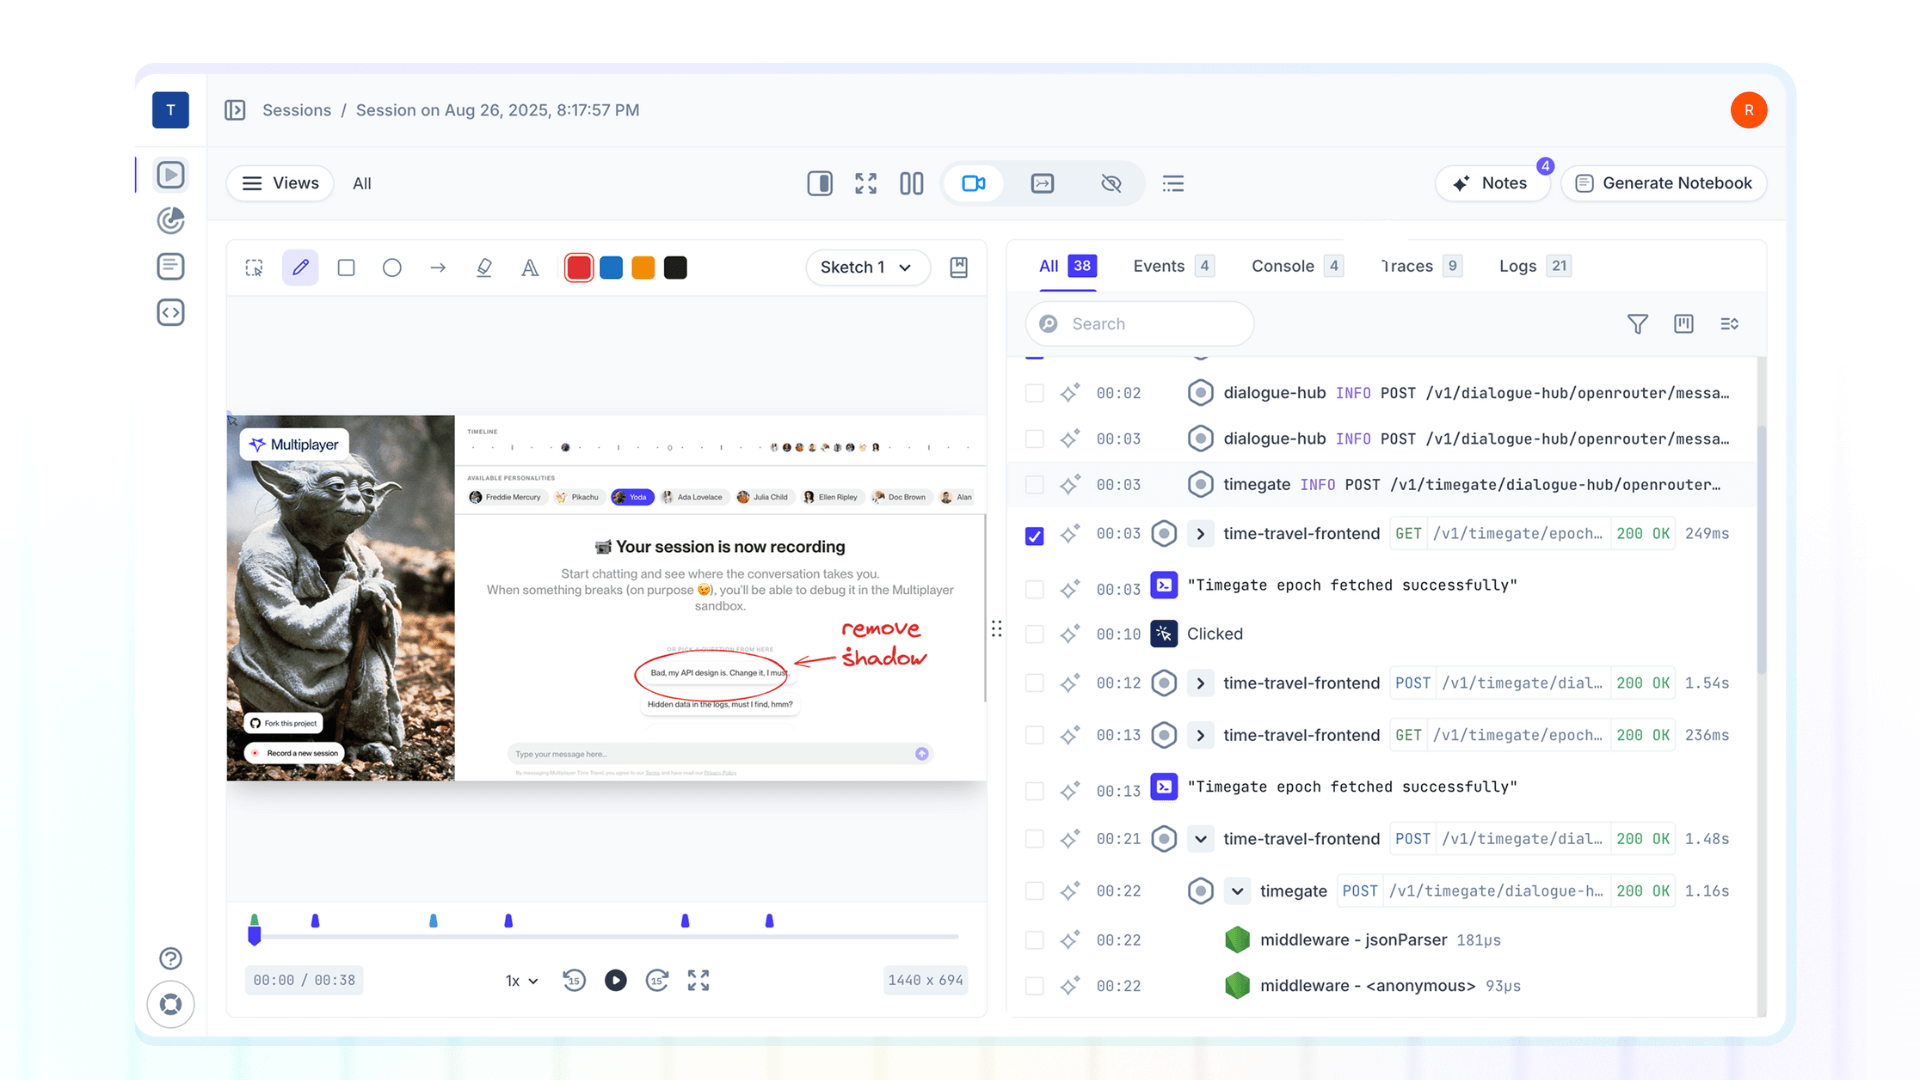
- Multiplayer correlates that backend data with the frontend replay and user actions in one timeline.
You can even enrich sessions with request/response content and headers from deep within your system (i.e. middleware and and internal service calls), so your recordings carry the exact system-level detail you need.
Why zero sampling matters
With Multiplayer, you don’t just hope the trace you need was captured; you know it was. That means:
- Confidence you’ll have the data for any bug, no matter how rare or hard to reproduce.
- Precision in debugging: see exactly how a user action propagated across services.
- AI-ready context: feed your IDE or copilot the complete, correlated trace plus everything else from the recording: frontend screens, user actions, team sketches and notes.
You get the whole story, every time, without the overhead of “log everything” and without the blind spots of sampled traces. That’s what makes full stack session recordings more than just a replay.
👀 If this is the first time you’ve heard about Multiplayer, you may want to see full stack session recordings in action. You can do that in our free sandbox: sandbox.multiplayer.app
If you’re ready to trial Multiplayer you can start a free plan at any time 👇