Guide
Session Replay: Best Practices & Examples
Table of Contents
Session replay began as a frontend-centric tool to record DOM changes, clicks, scrolls, and other UI interactions to help developers understand how users experienced a web application. Early adopters relied on it primarily to troubleshoot visual bugs, identify usability issues, or see where users got stuck. It was powerful for frontend teams but offered limited insight beyond the browser.
Today's complex software architectures require a much greater degree of visibility. Replays that show only user behavior lack the correlated contextual data that modern engineers need to trace requests through microservices, background jobs, and third-party integrations.
In this article, we explore how full-stack session replay addresses these gaps through the lens of best practices that will help engineers use session recording to debug distributed systems, collaborate, and develop new features more effectively.
Summary of session replay best practices
The following best practices represent core ways that session replay contributes to debugging distributed systems. Each practice addresses a challenge commonly faced by engineering, QA, or product teams, and how session replay helps overcome it.
| Best practice | Description |
|---|---|
| Capture full-stack session context for debugging | Go beyond traditional session replay by correlating frontend events with backend traces, logs, and network data—all aligned to the same session—for faster, more confident debugging and AI-assisted workflows. |
| Trace issues end to end with full-stack session replay | Link DOM events, API calls, backend logs, and distributed traces in a single, chronological view. |
| Reduce engineering costs with replay insights | Replay tools reduce MTTR and associated costs by lowering debug time and manual investigation. |
| Enhance incident response and the developer experience | Engineers can use replays during live incidents to quickly inspect user behavior and improve observability. |
| Prioritize features with behavioral data | Product managers can use real user behavior (not gut feelings) to prioritize features and the roadmap. |
| Reproduce bugs with traceable sessions | Replays streamline issue reproduction and traceability, improving developer-QA workflows. |
Capture full-stack session context for debugging
Sufficient monitoring and observability are only the first steps toward an effective debugging workflow. Even when applications are well-instrumented, a typical workflow looks like this: QA engineers find bugs during testing and pass them to a developer with a brief note explaining what went wrong. They may also send a screenshot, an error log, the whole log file with hundreds of log lines, and some links from the monitoring tool or the application.
What follows is often a game of guesswork. Developers search through scattered APM data and try to correlate relevant logs and traces with any other relevant information (frontend screens, user actions, request and response data, header content from inside the system, etc.). Next, they must attempt to recreate what happened in environments that often don't match production. It is time-consuming and frustrating, and the efficient resolution of such scenarios relies on the engineer's seniority and experience with the codebase.
Capturing full-stack session replays addresses these issues. Start by integrating a session replay SDK into your frontend to capture DOM events, masking sensitive inputs at the point of collection (e.g., maskSelectors: ['#password']). At the start of every user session, generate a unique session ID (e.g., using crypto.randomUUID()) and persist it (i.e., localStorage or a secure, SameSite cookie) to be retained upon page reload:
// Generate or reuse a persisted session ID
let sessionId = localStorage.getItem('session_id');
if (!sessionId) {
  sessionId = crypto.randomUUID();
  localStorage.setItem('session_id', sessionId);
}

// Attach correlation ID as a header to requests
fetch('/api/data', {
  headers: { 'X-Session-ID': sessionId }
});
The session ID can then be passed through backend calls using a custom header, such as X-Session-ID, as a correlation ID, or through metadata in asynchronous systems.
Next, set up backend middleware to log and read the session ID along with request and response metadata, ensuring that it is captured in any distributed tracing spans. To avoid losing session IDs across asynchronous boundaries (e.g., cron jobs, streams, or queued events), persist the ID as part of the message payload or use framework-specific context propagation utilities (like AsyncLocalStorage in Node.js or Mapped Diagnostic Context in Java).
For teams leveraging tools like Multiplayer, this correlation can be automated, allowing developers to access synchronized views of frontend, backend, and network activities without requiring custom stitching solutions.
Trace issues end to end with full-stack session replay
Traditional session replays show only browser activity (clicks, navigation) but leave backend traces, logs, API calls, and network behavior siloed across multiple tools. Today's engineering teams can't afford gaps between what users see and what the system does. With automation and AI accelerating everything from test generation to CI/CD pipelines, developers need precise, end-to-end context to diagnose issues efficiently.
For example, consider a checkout flow in a microservices architecture:
- A user clicks "Pay" in the UI (DOM event captured).
- The frontend triggers an API call to the payment service (session replay links the request payload).
- That service invokes the fraud detection service (correlation ID is carried across).
- Finally, the order service updates the database but fails due to a timeout.
In this scenario, developers should ensure that every hop forwards the same identifiers:
- For HTTP, use headers.
- For queues, include them in message metadata.
- In Java, attach to MDC so loggers emit session_id and trace_id.
- In Node.js, use AsyncLocalStorage to carry context through async boundaries.
Consider the Node.js code below:
// app.js
const express = require('express');
const crypto = require('crypto');
const { AsyncLocalStorage } = require('async_hooks');
const asyncLocalStorage = new AsyncLocalStorage();

const app = express();
app.use(express.json());

// --- Correlation middleware ---
app.use((req, res, next) => {
  const sessionId = req.header('X-Session-ID') || (crypto.randomUUID ? crypto.randomUUID() : crypto.randomBytes(16).toString('hex'));
  const traceparent = req.header('traceparent') || `00-${crypto.randomBytes(16).toString('hex')}-${crypto.randomBytes(8).toString('hex')}-01`;
  asyncLocalStorage.run({ sessionId, traceparent }, () => next());
});

// Helper to access current request context
const getContext = () => asyncLocalStorage.getStore() || {};

// Minimal logger
const log = (message, extra = {}) => {
  const { sessionId, traceparent } = getContext();
  console.log({ message, sessionId, traceparent, ...extra });
};

// Payment endpoint
app.post('/api/payment', async (req, res) => {
  const { sessionId, traceparent } = getContext();
  log('charge attempt', { amount: req.body?.amount });

  try {
    const r = await fetch('http://payment-svc/charge', {
      method: 'POST',
      headers: { 'Content-Type': 'application/json', 'X-Session-ID': sessionId, traceparent },
      body: JSON.stringify({ amount: req.body?.amount })
    });
    log('charge response', { status: r.status });
    res.status(r.ok ? 200 : 502).json({ ok: r.ok });
  } catch (err) {
    log('charge error', { error: err.message });
    res.status(502).json({ ok: false });
  }
});

module.exports = app;
In this example, the correlationMiddleware captures the X-Session-ID and traceparent headers on ingress and stores them in AsyncLocalStorage to make them available throughout the request's async call chain. Implementing session replay in this way allows engineers to follow the request from the DOM event to the API call, backend logs, and distributed trace spans where the timeout occurred.
Full-stack session recording
Learn more


Reduce engineering costs with replay insights
Debugging hard-to-reproduce issues is one of the largest hidden costs in engineering. If developers are wasting hours debugging infrequently reproducible issues, velocity decreases, morale suffers, and costs escalate. The value of replay tools shines when you're deep in triage mode. Instead of having to recreate an error locally—and often unsuccessfully—developers can open a session and see the whole sequence that led to the issue.
To begin adopting this approach, incorporate replay links into your incident templates or bug tickets to ensure that every investigation starts with a shared, replayable source of truth. In Jira, this can be automated by passing the session ID or replay URL as a custom field via the Jira REST API when the ticket is created or by using an "Add replay link" workflow button so agents can attach it in one click.
This workflow can also streamline customer support. Rather than escalating bug reports to engineers due to missing information, support agents may be able to quickly confirm what went wrong and provide feedback directly to customers. If not, they can gather full context before escalating to engineering so that engineers do not have to search logs or try to reproduce the problem manually from vague descriptions.
This approach shortens the feedback loop and helps teams fix issues without unnecessary back-and-forth. Over time, this approach builds trust: fewer unresolved issues and faster fixes translate to happier users and better support and quality metrics.
Interact with full-stack session recordings to appreciate how they can help with debugging
EXPLORE THE SANDBOX(NO FORMS)
Enhance incident response and the developer experience
During outages or regressions, time is everything. On-call engineers need to diagnose and resolve issues quickly, and session replay can play a significant role.
For example, you could tie a feature flag into your logging system so that when it's activated, session replays automatically enrich recordings with extra metadata, such as API payloads, trace IDs, and browser console logs. In practice, this works by wiring the toggle to enable verbose logging in both the frontend SDK and backend middleware at the same time. One way to implement this is to use a simple POST request to enable incident mode for a set duration:
POST /ops/incident-mode?minutes=15The backend uses the request to return a time-to-live (TTL) value for the incident mode, which clients use in the X-Incident-Mode-Until header on subsequent requests:
// POST route to enable incident mode
app.post('/ops/incident-mode', (req, res) => {
  const minutes = parseInt(req.query.minutes) || 15;
  res.json({ ok: true, incidentModeExpiresAt: Date.now() + minutes * 60 * 1000 });
});

// Middleware: attach session + trace IDs, toggle enrichment
function correlationMiddleware(req, res, next) {
  const sessionId = req.header('X-Session-ID') || 'unknown';
  const traceId   = req.header('traceparent')  || 'unknown';
  const incidentUntil = parseInt(req.header('X-Incident-Mode-Until')) || 0;
  const enrich = incidentUntil > Date.now();

  req.context = { sessionId, traceId, enrich };
  next();
}

app.use(correlationMiddleware);

// Log extra debug info when enrichment is on
app.use((req, res, next) => {
  if (req.context.enrich) {
    console.log('incident_mode_debug', {
      sessionId: req.context.sessionId,
      traceId: req.context.traceId,
    });
  }
  next();
});
You can scope this to a specific transaction, user, or timeframe so that only the incident window gets the extra detail. This keeps overhead low while guaranteeing that replays contain everything needed for root-cause analysis. Some teams even integrate this with their incident management playbooks so that activating "incident mode" automatically flips the toggle, captures enriched sessions, and links them to the incident ticket. This way, even if they can't handle the situation, they can still provide accurate feedback to stakeholders and team peers. The process connects human experience with system behavior, mitigating the frustration that engineers feel after failing to respond adequately to critical situations.
One click. Full-stack visibility. All the data you need correlated in one session
RECORD A SESSION FOR FREEPrioritize features with behavioral data
Product teams can sometimes rely on intuition or be driven by competition to guide roadmap decisions. However, instinct can't compete with real-world usage data. Session replay provides product managers with direct insight into which features and app flows are used and how. By watching real sessions or analyzing usage patterns across flows, product managers can answer important questions like:
- Are users completing critical business flows?
- Which features cause confusion or abandonment?
- What behaviors correlate with retention or churn?
One effective practice is to treat session replays as a direct input during product discovery sessions. Right after identifying critical questions—such as where users churn or which flows cause friction—PMs can curate specific replay clips that validate (or challenge) their assumptions. When included in a requirement document, proof of concept, or feature/refactor proposal, these replays anchor product decisions in real usage data and reduce the risk of investing in features that miss the mark.
If a new feature rolls out and only a few percent of users interact with it, that's more than a curiosity; it's a signal worth digging into. Using session replay, product teams can observe how users move through the product interface, monitor custom funnels, and identify where users' attention shifts and what may be drawing them away from key interactions. Instead of just knowing what was clicked, teams learn how a feature fits into real user behavior, helping them refine UX or reprioritize roadmap decisions with concrete evidence.
Reproduce bugs with traceable sessions
Finding and fixing bugs in distributed systems can be challenging. Logs may show an API call without indicating the related changes in the user interface (UI), or they may show the UI change without the API call. Session replay helps you track what happened, while distributed tracing explains why and where issues occur at the service level. Let's explore how to effectively combine these two approaches.
First, ensure that you share trace context consistently. The W3C Trace Context standard defines two headers to help with this:
traceparentcarries trace and span IDs.tracestatecarries vendor-specific metadata.
You can use these headers to connect logs, metrics, and traces across various types of communications (HTTP, gRPC, messaging) and across background jobs to keep the trace intact. To add these headers to requests and extract them for processing, observability frameworks like OpenTelemetry provide auto-instrumentation and SDKs for most languages. For example, the Node.js code below utilizes OpenTelemetry to automatically inject traceparent and tracestate into HTTP requests:
const { NodeSDK } = require('@opentelemetry/sdk-node');
const { getNodeAutoInstrumentations } = require('@opentelemetry/auto-instrumentations-node');
const { ConsoleSpanExporter } = require('@opentelemetry/sdk-trace-base');
const fetch = require('node-fetch');

// Configure SDK
const sdk = new NodeSDK({
  traceExporter: new ConsoleSpanExporter(),
  instrumentations: [getNodeAutoInstrumentations()],
});

sdk.start();

async function callApi() {
  await fetch('http://localhost:4000/api/data');
  // OpenTelemetry automatically attaches traceparent + tracestate headers
}

callApi();
Next, link replay sessions to traces and logs. Save the session ID from the replay alongside the trace ID, and incorporate trace and span IDs into your log messages. This way, when troubleshooting, you can easily transition from the replay timeline to the trace view and then to related logs:
const sessionId = localStorage.getItem('session_id') ?? (() => {
  const id = crypto.randomUUID();
  localStorage.setItem('session_id', id);
  return id;
})();

// Example middleware
app.use((req, res, next) => {
  console.log(`trace=${req.headers['traceparent']} session=${sessionId}`);
  next();
});
Sampling and synchronization
Be strategic about sampling. Begin by capturing a higher percentage of data (such as 25% to 50%) to understand traffic patterns and then reduce it for routine processes. Always sample error data to ensure that the replay includes relevant trace information.
In addition, to allow sessions recorded in the browser to align with backend spans, make sure that trace headers are shared across different origins (CORS).
Finally, utilize service maps to identify where issues occur. Visualize the connections from the trace data to determine where delays happen or where errors accumulate and then focus on the specific span chain that is causing problems.
Integrating with session replay tools
Once these connections are in place, you can integrate with external tooling to capture recorded sessions. For example, Multiplayer's full-stack session recordings capture frontend interactions and associate them with relevant traces, logs, and request/response and header content (including from inside the system components, going from one service to another), which helps developers correlate user actions with backend behavior.


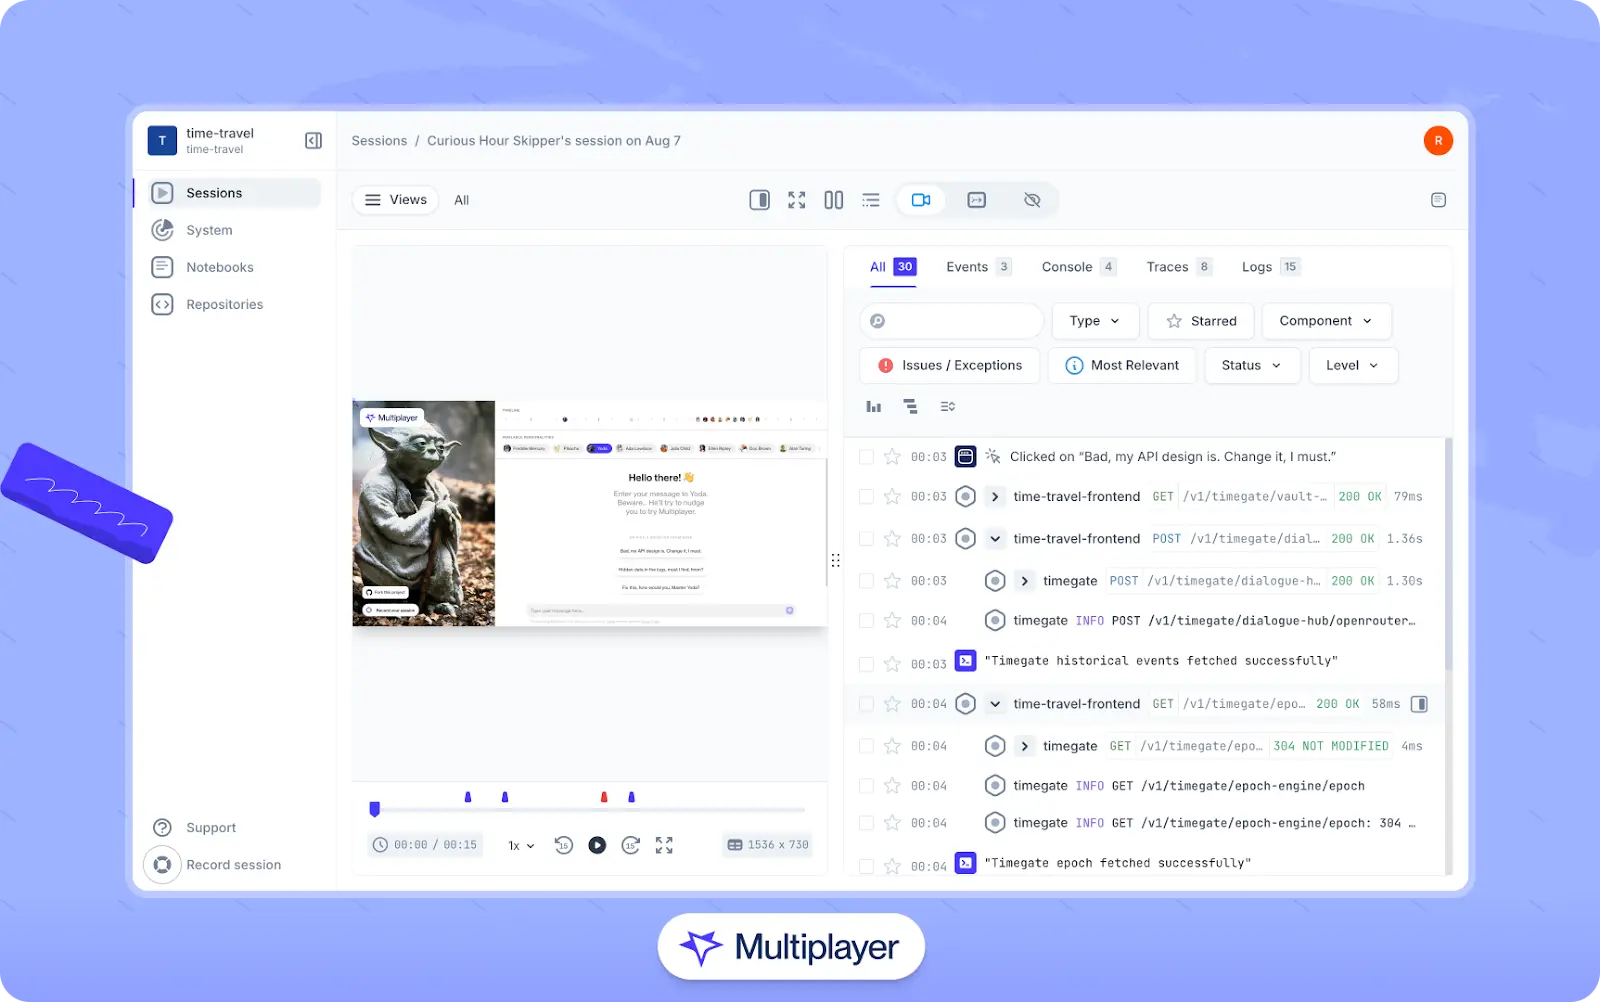
Multiplayer's full-stack session recordings
QA can share the replay link, and developers can quickly locate the exact trace and logs for a particular request. This dramatically reduces back-and-forth and results in more deterministic debugging because the replay already contains the key frontend and backend context needed for triage.
Stop coaxing your copilot. Feed it correlated session data that’s enriched and AI-ready.
START FOR FREEConclusion
Session replay isn't just a technical enhancement for developers; it's a layer that binds user experience with product goals and system behavior. It helps customer support close more tickets without escalation to engineering. It gives QA visibility into how bugs emerge in real-world conditions, and it empowers product owners to make decisions based on actual usage, not assumptions. It doesn't take days to implement or expensive infrastructure to run. Setup is quick without affecting the performance of the application, and the returns grow as more teams integrate it into their daily work.
Debugging in distributed systems is often like trying to track down a mystery, where you find pieces of the puzzle scattered across multiple services. It can be frustrating as you chase down various clues only to discover that the real issue hides somewhere else. Session replay cuts through that noise and turns vague bug reports into concrete, replayable experiences that engineers can analyze and fix with confidence.