Guide
Software Troubleshooting: Best Practices & Examples
Table of Contents
Troubleshooting software in distributed systems is fundamentally different from debugging a monolith application. Failures ripple across services, regions, protocols, and layers. Errors often manifest far from their root causes, latency compounds, and logs rarely line up cleanly. To make progress in such environments, you need visibility across infrastructure, a way to propagate context across services, and tools that allow you to trace requests through the system.
In this article, we go beyond standard logging and "check-the-metrics" advice and dive into the real-world practices that make troubleshooting effective in environments with partial failures, noisy observability data, and asynchronous workflows. These techniques will sharpen your debugging workflow, strengthen your failure recovery path, and improve your system's long-term resilience.
Summary of software troubleshooting best practices
| Best practice | Description |
|---|---|
| Implement comprehensive observability with correlation IDs | Establish unified, queryable telemetry across services using structured logs, distributed tracing, and real-time metrics to track system behavior and correlate failures. |
| Proactively inject faults with chaos engineering | Intentionally introduce controlled failures across layers to validate system resilience, test fallback mechanisms, and surface recovery weaknesses before they impact users. |
| Leverage code knowledge for root cause analysis (RCA) | Augment runtime data with static code analysis to trace logs back to source, reconstruct execution paths across services, and localize bugs with targeted code profiling. |
| Master container-level debugging | Inspect live containers via shell access, remote debuggers, and runtime state tools to troubleshoot misconfigurations, resource constraints, and environment-specific issues. |
| Enhance debugging with AI coding assistants | Feed AI coding assistants context from observability data to generate actionable fix suggestions and accelerate troubleshooting. |
| Cultivate a blameless postmortem culture | Normalize incident analysis through structured, constructive reviews that focus on systemic causes, encourage transparency, and drive long-term reliability improvements. |
Implement comprehensive observability with correlation IDs
Debugging distributed systems requires end-to-end visibility: You need to follow a request across services, threads, and sometimes even protocols. Correlation IDs make traceability possible by connecting logs, traces, and metrics across the system. Effective observability requires instrumentation, ensuring that every team member can use the data to investigate failures without waiting on a platform or SRE team. Making logs, metrics, and traces available early in the development cycle shifts observability left and empowers developers to diagnose issues, validate fixes, and improve reliability themselves.
Centralized logging
Log fragmentation is a major bottleneck in distributed troubleshooting. Logs become significantly more valuable when they are centralized and structured to support trace systems, anomaly detectors, and now AI-based debuggers.
To make logs both machine-readable and user-friendly, enforce structured formats across all services. Prefer newline-delimited JSON (ndjson), where each log line includes standardized fields such as:
- Timestamp (in ISO 8601 or RFC 3339 with timezone)
- Service and instance ID (to locate the source)
- Level (e.g., debug, info, error)
- Message (prefer static templates over fully interpolated values)
- Correlation ID and request ID (to stitch together execution context)
Custom fields should be namespaced and schema-validated to avoid collisions. For example, use http.status_code instead of a flat status field to support nested filtering and metric derivation.
All application layers should emit logs with a consistent field structure and correlation context. For example, in a gRPC service, interceptors can attach request metadata to the logger context, ensuring that downstream logs carry the same trace lineage. Use middleware to inject correlation IDs and propagate them downstream.
Finally, set up automated alerts on top of log streams by parsing error rates, exception types, and service-level patterns, such as bursts of 5xx from a single shard. Logging platforms should support saved queries and dashboard visualizations that integrate with incident response tooling. Ideally, alert messages should deep-link to filtered logs for faster triage.
Distributed tracing
Unlike logs, which are fragmented and localized, traces provide a unified view of execution across services, threads, and sometimes infrastructure boundaries. Implementing tracing effectively requires consistent context propagation, precise instrumentation, and usable visualizations.
Start by standardizing around a tracing system like OpenTelemetry, which provides language-agnostic SDKs and exporters. Instrument your services at ingress and egress points so you can see traffic flowing across RPC boundaries, background tasks, and asynchronous queues. Each operation in a trace is recorded as a span, containing its start and end timestamps, service name, operation name, attributes (tags), and status:
{
  "trace_id": "8af7651916cd43dd8448eb211c80319c",
  "span_id": "b9c7c989f97918e1",
  "parent_span_id": "5c1c63257de34c67",
  "name": "charge_card",
  "service": "payment-service",
  "start_time": "2025-09-05T12:34:56.123Z",
  "end_time": "2025-09-05T12:34:56.456Z",
  "attributes": {
    "order.id": "12345",
    "payment.provider": "stripe",
    "amount": "99.00"
  },
  "status": "OK"
}
Ensure complete trace context propagation by forwarding trace_id, span_id, and parent_span_id across all protocols and transports. For HTTP, propagate headers, and inject trace context into metadata and message headers. Tag latency-critical regions such as:
- External API calls and third-party integrations
- Database queries (especially those with high cardinality and joins)
- Cache accesses and misses
- Retry loops and fallback handlers
- Circuit breaker states and timeout events
Annotate these spans with domain-specific metadata, such as customer IDs, operation types, and product SKUs. This enables high-cardinality filtering during triage and allows correlation with business metrics.
For example, consider an order checkout workflow that spans multiple services. The frontend sends a request to the API gateway, which then calls the payment service, inventory service, and shipping service in sequence. By propagating traceId, spanId, and parentSpanId across each hop, you preserve the full execution path.
import logging
import requests
from opentelemetry import trace
from opentelemetry.propagate import inject
from base.urls import inventory_url, payment_url, shipping_url

logger = logging.getLogger(__name__)
tracer = trace.get_tracer(__name__)

def process_checkout(order_id, customer_id, sku, payment_payload):
    with tracer.start_as_current_span("checkout") as checkout_span:
        checkout_span.set_attribute("order.id", order_id)
        checkout_span.set_attribute("customer.id", customer_id)
        checkout_span.set_attribute("sku", sku)

        with tracer.start_as_current_span("payment_service") as payment_span:
            payment_span.set_attribute("payment.amount", payment_payload['amount'])
            payment_span.set_attribute("payment.method", payment_payload['method'])
            headers={}
            inject(headers)
            response = requests.post(
                payment_url,
                json=payment_payload,
                headers=headers
            )
            logger.info("Payment service response",
                        extra={
                            "trace_id": payment_span.get_span_context().trace_id,
                            "span_id": payment_span.get_span_context().span_id,
                            "status_code": response.status_code
                        })
        with tracer.start_as_current_span("inventory_service") as inventory_span:
            inventory_span.set_attribute("sku", sku)
            headers={}
            inject(headers)
            requests.post(inventory_url, json={"sku": sku}, headers=headers)

        with tracer.start_as_current_span("shipping_service") as shipping_span:
            shipping_span.set_attribute("order.id", order_id)
            headers={}
            inject(headers)
            requests.post(shipping_url, json={"orderId": order_id}, headers=headers)

if __name__ == "__main__":
    process_checkout(order_id="ORD-1234", customer_id="CUST-5678", sku="SKU-9999", payment_payload={"orderId": "ORD-1234", "amount": 199.00, "method": "Credit card"})
Let's say that in this trace, latency spikes appear in the payment service's external API call to a third-party payment processor. When the span is annotated with the customerId, orderId, and payment method, it allows you to filter for failures affecting specific customers or transaction types. Similarly, you can annotate database queries or cache accesses—such as SKU lookups with high-cardinality joins—to isolate bottlenecks, retry loops, or circuit breaker trips.
Use trace visualizations to surface performance bottlenecks, such as:
- Long tail latency contributors within parallel calls
- Nested retries that are causing increased end-to-end duration
- Cascading failures across service boundaries triggered by shared dependencies
- Synchronous RPC chains that could be replaced with async messaging
Identify failed spans quickly by searching for those marked with an error status or abnormal durations. Tie these failures back to logs (using traceId) so that failures can be investigated in full context. If logs include correlation IDs but not trace IDs, consider emitting both or indexing logs against trace metadata.
logger.info("Payment service response",
                        extra={
                            "trace_id": payment_span.get_span_context().trace_id,
                            "span_id": payment_span.get_span_context().span_id,
                            "status_code": response.status_code
                        })
In the example above, we log both trace_id and span_id. You can also generate a correlation_id as below and add it to the log messages:
import uuid
correlation_id = str(uuid.uuid4())
Ensure that sampling strategies are aligned with operational goals. Head-based sampling (at ingress) should retain representative traces for low-traffic services and errors. Tail-based sampling, when supported, can keep only high-latency or error-prone traces. High-traffic systems should implement dynamic sampling to avoid overwhelming storage while preserving critical signals.
Full-stack session recording
Learn more


Health and metrics monitoring
A common way to monitor your system's health and performance is to expose the following endpoints:
/healthfor liveness and readiness checks/metricsfor metric scraping/envfor environment and build metadata
System-level metrics give you the early warning signs. Track thread pool utilization, heap memory consumption, garbage collection rates, database connection pool saturation, HTTP status code distribution, and request latency percentiles. A steady rise in connection pool usage can be the first hint that your system is drifting toward failure.
For example, tracking cart_checkout_success_rate, email_queue_lag, or payment_gateway_error_count puts you in a position to spot workflow-specific problems before customers notice. Tag similar workflows with a consistent label, service name, region, and deployment version, so you can filter and correlate them across environments.
All of this data should be continuously collected into a central time series store and visualized in dashboards that show the system's health and business performance at a glance. From there, set meaningful alerts for latency outliers in critical endpoints, sustained spikes in 5xx errors, growing queue depths, etc.
Proactively inject faults with chaos engineering
Some teams rely on monitoring and post-incident investigation but rarely validate that their fallback paths, retries, circuit breakers, and failover strategies work under real conditions. Without this validation, an outage is the first time you discover that these safeguards are incomplete or ineffective.
Chaos engineering is an effective practice to surface these weaknesses before they turn into incidents. Instead of waiting for outages to reveal hidden issues, you deliberately introduce controlled faults to expose them early. This transforms reliability from something you assume to something you've measured, documented, and improved through repeated tests.
Controlled fault injection
Start by targeting different layers of the stack to simulate realistic failure modes at different application layers. At the compute level, this might mean shutting down EC2 instances or killing Kubernetes pods mid-transaction. Network faults can be induced using iptables to introduce latency, packet loss, and bandwidth throttling, while storage failures can be simulated by injecting disk errors and filling volumes. Application-layer faults include dropping Kafka messages, returning stale DNS records, crashing critical processes, etc.
These experiments validate whether fallback logic, retries, circuit breakers, and SLA degradation mechanisms behave as designed when components fail.
Safe experiment design
You should run experiments in pre-production with synthetic traffic to ensure that the tooling and rollback processes work as intended. Begin with a minimal blast radius, such as a single container handling non-critical traffic at low TPS. Define clear hypotheses and document the expected system responses before execution.
Always define abort conditions, metrics, and signals that indicate that the test is causing excessive damage, and implement automated rollback scripts to restore normal operation within seconds. For example, the following Node.js code monitors an email service queue and automatically triggers a rollback via Kubernetes if the queue exceeds a safe threshold:
import { exec } from "child_process";
import fetch from "node-fetch";

const DEPLOYMENT = "email-processor";
const ABORT_THRESHOLD = 100; // max acceptable queue length

async function getQueueLength() {
  const res = await fetch('http://prometheus.example.com/api/v1/query?query=email_queue_lag');
  const data = await res.json();
  return parseInt(data.data.result[0].value[1], 10);
}

async function rollback() {
  await exec(`kubectl rollout undo deployment/${DEPLOYMENT}`);
  console.log("Rollback complete");
}

async function monitor() {
  const lag = await getQueueLength();
  if (lag > ABORT_THRESHOLD) {
    console.log("Queue lag too high, rolling back...");
    await rollback();
  }
}

setInterval(monitor, 15000); // check every 15s
Measuring the impact
As you begin to implement chaos engineering, use observability tools to track how the injected failures propagate and how quickly recovery occurs. Measure time to recovery, incident detection latency, the scope of affected services, and the performance of automated failover mechanisms. After each experiment, conduct a detailed analysis to identify systemic weaknesses and prioritize improvements.
Interact with full-stack session recordings to appreciate how they can help with debugging
EXPLORE THE SANDBOX(NO FORMS)
Leverage code knowledge for root cause analysis (RCA)
Logs, traces, and metrics provide valuable runtime signals, but they often describe symptoms without pinpointing the causes. When a system degrades or fails, you need to connect those signals back to the code that produced them. Effective RCAs combine observability data with a precise understanding of control flow, module boundaries, and source context to turn a runtime anomaly into a code-level explanation that you can act on.
Bridging logs with source code
Use static analysis to map runtime logs back to their originating code statements, even when variables are dynamically interpolated. This allows you to move from a vague runtime error to the exact method or class responsible. Building an index that connects runtime log output to source locations accelerates triage, especially in large codebases where manually searching for log strings is time-consuming and wastes valuable resources.
Reconstructing execution paths
After combining traces with control flow graphs derived from the codebase, you can recreate the full execution path of a failing request. Then you can highlight divergent paths by comparing them with baseline successful executions, making it easier to isolate the faulty edge case or missing guard. Additionally, link RPC stubs to their corresponding handlers (for example, in gRPC systems) to ensure that the reconstructed path reflects the true client–server lifecycle.
Focus on failure-relevant code
Once the failing path is known, narrow the scope of analysis by indexing method-level metadata, such as signatures and dependencies. This allows you to slice the codebase down to only the modules involved in the failure. Enrich these findings with telemetry signals, including error logs, failed spans, and anomalous metrics to improve precision.
Enhance debugging with AI coding assistants
Modern AI coding assistants can accelerate debugging far beyond simple code completion. When paired with observability data, they can help the organization navigate complex distributed systems.
Scoped code and config input
Instead of uploading the entire codebase, share only the code paths, configs, and dependency manifests relevant to the failure. For example, send the handler function and service client for the failing endpoint, the Kubernetes deployment spec and ConfigMaps for the affected pod, or the lock file if a dependency mismatch is suspected. Being more strategic about inputs reduces noise and helps the assistant–or anyone else reviewing the issue–focus on relevant information.
Contextual prompting with observability data
AI assistants become significantly more effective when given rich, real-time system context. Instead of pasting only an error message, provide targeted logs, metric snapshots, and traces from your observability stack. For example:
- Include the exact request trace from OpenTelemetry showing the span where latency spikes occur.
- Provide correlated logs from stdout and application-specific files for the same timestamp range.
- Attach key metrics such as CPU/RAM usage, connection pool usage, etc., to help the AI reason about performance-related failures.
Full-stack session recordings
Full-stack session recordings are an effective way to provide both humans and AI assistants the context they need. Using a tool like Multiplayer, developers and users can record sessions that include both frontend user interactions (clicks, inputs, navigation) and backend events (API calls, database queries, errors). Recordings capture all contextual data relevant to a given session, such as user actions, traces, logs, requests, responses, header data, plus user annotations. QA teams, customers, and stakeholders can report bugs without writing "steps to reproduce," and developers can use this data to pinpoint issues manually or as input for copilots or AI IDEs.


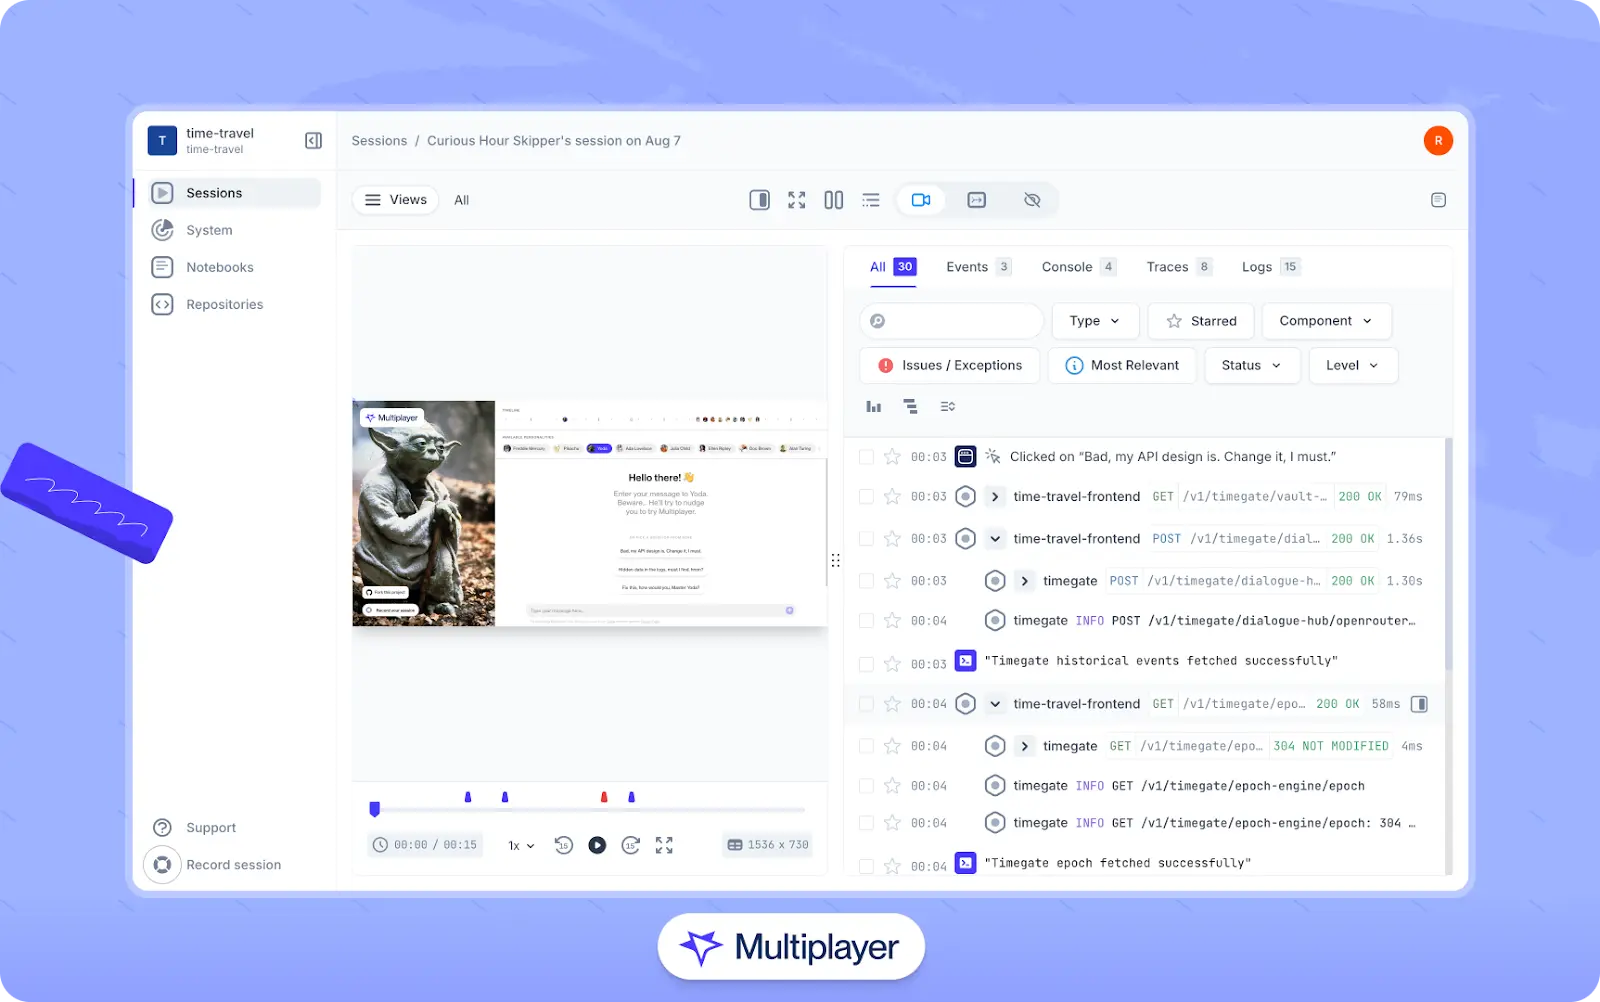
Multiplayer's full-stack session recordings
Master container-level debugging
Live shell access
When a production issue surfaces inside a containerized workload, direct shell access is often the fastest route to diagnosis. docker exec or kubectl exec allow you to enter a running container, while ephemeral Kubernetes debug containers offer a controlled, disposable shell that avoids modifying the primary workload.
Once inside, you can perform several actions:
- Inspect the filesystem for missing or corrupted configuration files.
- Verify mounted secrets, certificates, and key files for correct permissions and formats.
- Explore log directories, /tmp paths, and application-specific cache folders to confirm expected output.
- Run service-specific health checks and dependency binaries to detect missing packages or packages with incorrect versions.
When you're inside a production-like runtime with the same environment variables, network policies, and mounted volumes, it becomes much easier to pinpoint whether the root cause stems from configuration issues, missing dependencies, or runtime behavior.
One click. Full-stack visibility. All the data you need correlated in one session
RECORD A SESSION FOR FREERemote debugging setup
In some cases, issues only emerge under real production traffic. Problems like race conditions, thread contention, or state corruption are especially hard to pin down because they rarely appear in local environments.
When these issues arise, one option is to attach your IDE directly to the live container. You can do this by exposing a debug port (such as 5005 for Java or 9229 for Node.js) through the Dockerfile or Kubernetes manifest and then securing it with network policies:
apiVersion: apps/v1
kind: Deployment
metadata:
  name: node-debug-service
spec:
  replicas: 1
  selector:
    matchLabels:
      app: node-debug-service
  template:
    metadata:
      labels:
        app: node-debug-service
    spec:
      containers:
        - name: node-service
          image: my-registry/node-debug-service:latest
          ports:
            - containerPort: 3000   # app port
            - containerPort: 9229   # debug port
This setup allows you to attach tools like Chrome DevTools or VS Code to the running service. In Kubernetes, you can secure the debug port with a network policy or access it via kubectl port-forward:
kubectl port-forward deployment/node-debug-service 9229:9229Runtime state inspection
Runtime tools can also help you inspect the system state. Some common commands include:
printenvto verify environment variables,ps aux,htopto spot hung threads or memory leakscurl,telnet, andnslookupto confirm DNS and network connectivity
You should also check volume mounts to ensure that logs, SSL certificates, and configuration files are present with correct permissions because missing or misconfigured files can block services from starting, break secure connections, or hide debugging information.
Cultivate a blameless postmortem culture
A mature incident management process requires a postmortem culture that prioritizes learning over blame. Assume that every action taken during an incident was made with the best available information at the time so that engineers feel safe to disclose missteps, partial fixes, and uncertainties.
Documentation also plays a key role. Use a consistent template to record incident timelines, quantified impact, detection method, mitigation steps, RCA (immediate triggers vs. systemic causes), contributing factors, and follow-up actions with owners and SLAs. Include supporting evidence such as logs, trace snapshots, dashboards, and key communications.
Where possible, store this information in a shared workspace so that it is easily available. Collaborative notebooks can be used to centralize information that often lives in separate systems, such as system requirements, design decisions, ADRs, executable API call examples, and code snippets. The goal is to provide a workspace where different stakeholders can communicate and review postmortems to make findings clear and actionable.

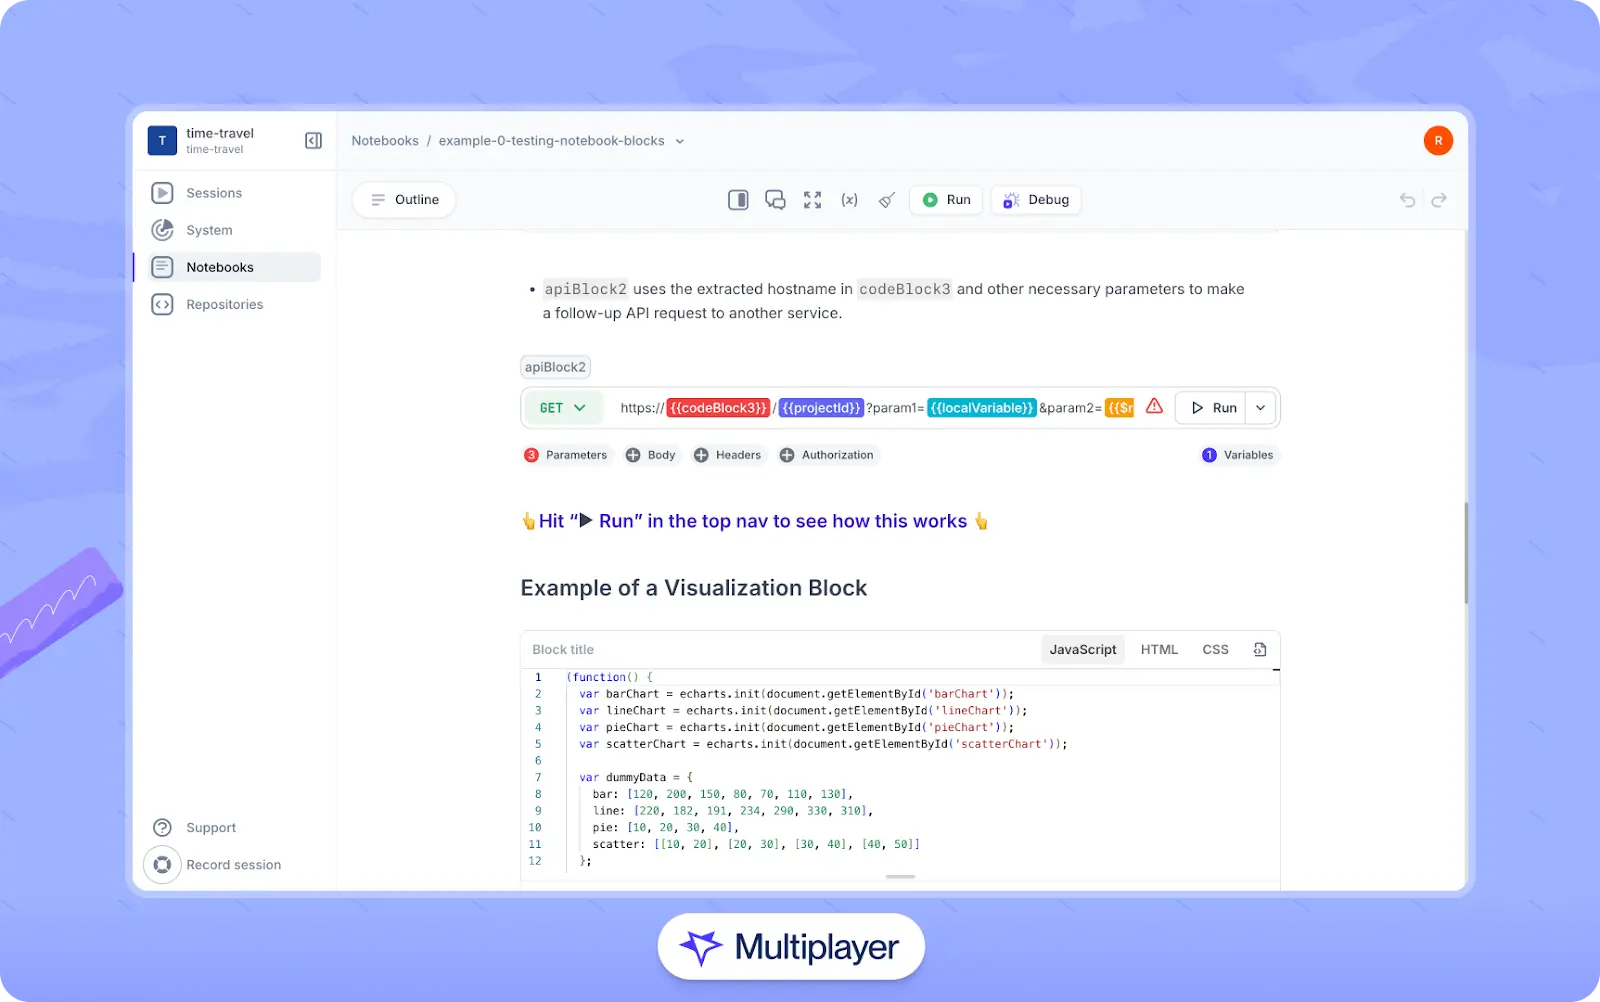
Multiplayer notebooks
Stop coaxing your copilot. Feed it correlated session data that’s enriched and AI-ready.
START FOR FREELast thoughts
Troubleshooting modern systems is about understanding complexity. Every failure is a window into the interplay between code, infrastructure, and human decisions. Observability gives us the lens to see these interactions, chaos engineering lets us probe their limits, and root cause analysis bridges the gap between symptoms and underlying design.
Approaching failures thoughtfully means creating processes and habits that uncover insights reliably. Live debugging, AI-assisted analysis, and structured postmortems allow teams to learn from each incident and iteratively strengthen the system. In this way, reliability becomes not just a goal but a practice cultivated through curiosity, rigor, and collaboration.