Guide
User Session: Tutorial & Use Cases
Table of Contents
A user session is a trail of continuous interactions between a user and a web-based system that begins when the user engages with the system and ends when the user logs out or the session times out. Maintaining a user session provides a smooth, continuous experience by maintaining state, keeping a logged-in user authenticated, and preserving user identity across requests. On the development side, sessions provide engineers with important information to support security features, gather performance insights, and collect data for debugging and troubleshooting.
In this article, we explore how user sessions are maintained, how developers manage them, and how they can be leveraged across different development use cases. We will also highlight common patterns, practical considerations, and emerging approaches that help teams build more reliable, performant, and user-friendly applications.
Summary of key user session concepts
The table below summarizes four key user session concepts that this article will explore in more detail.
| Concept | Description |
|---|---|
| User session management | Session management techniques employ cookies, session IDs, and tokens to maintain a verifiable chain of identity across system interactions. |
| Session recording for debugging and product improvement | Correlating user actions with backend telemetry enables faster, more reliable reproduction and resolution of user-facing issues. |
| Performance monitoring and troubleshooting | Linking telemetry data to individual sessions exposes latency and reliability problems that traditional metrics can miss. |
| Leveraging session data for AI workflows and automation | Structured session data supplies contextual training signals that enhance AI-assisted development, quality assurance, and workflow optimization. |
User session management
A user session encompasses the interactions between a user and an application. In a complex distributed system, this often includes communication with internal and external services that are unrelated to one another, such as authentication, payments, or lookups. Users might sign in via Google, GitHub, or social media, interact with internal services that facilitate core business logic, and make payments through PayPal or Apple Pay. To the user, this must feel like one continuous experience, which means that different components and services must have access to shared session state, typically via cookies, session IDs, or tokens.
A session can be authenticated or anonymous. In an anonymous session, a unique session ID is generated when the user first accesses the application or site. It identifies the session, not the person, and is maintained with every request so that server responses are specific to that session. One example of an anonymous session use case is preserving a shopping cart for an unauthenticated user.
In an authenticated session, an ID is assigned when the user presents valid login credentials or when the user is validated via a third-party account, such as social media, Google, or GitHub. As with an anonymous session, the session identifier is stored in a browser cookie that may contain an authentication token.
Stateless tracking
Because HTTP requests are stateless, session tracking must rely on an identifier or token sent with each request, which is typically stored in the HTTP header. In sessions that involve multiple internal services, JSON Web Tokens (JWTs) are often used to reduce database lookups. A JWT stores essential user data in a self-contained token, passed in the HTTP Authorization header in the format:
Authorization: Bearer [token]A JWT has three base64-encoded parts: header, payload, and signature in the format:
<header hash>.<payload hash>.<signature hash>The header and payload are decoded into readable JSON. The signature is a signed copy of the header and payload, generated when the user is authenticated. The signature can't be reverse-engineered or altered, so attempts at hacking the header or payload will produce an invalid token. Storing user data in JWTs allows services to trust each request without additional round-trips to a shared session store.
Full-stack session recording
Learn more


User session security considerations
Effective security requires a balance between user convenience and the protection of sensitive data. For example, one very common security consideration is determining when a user session should be terminated. Logging out naturally ends a session immediately. However, when a user abandons a session, either by neglecting to log out or simply leaving a browser tab idle, systems must detect the absence of activity and end the session after a predetermined timeout interval. Timeouts vary by risk: highly sensitive applications, such as banking, will time out in minutes, while less sensitive applications, such as e-commerce platforms, might remain active for months.
The timeout process includes invalidating the token or session ID used to track the session. There are two types of tokens:
- Access tokens provide authorization for user requests
- Refresh tokens update access tokens to ensure they can be short-lived without disrupting user experience
Access tokens expire quickly (5-15 minutes) to limit vulnerability if stolen. Refresh tokens last longer and silently renew access tokens before expiry.
While a website that adheres perfectly to best security practices is unlikely to expose a session token to a malicious party, developers must still plan for worst-case scenarios. To protect session tokens, session IDs should be stored as Secure, HttpOnly cookies in the browser, with the sameSite flag set. Here's how this would look in Node.js using Express:
// Demo only: sets a cookie on every request
app.use((req, res, next) => {
  // Example session token -- normally generated by a session middleware
  const sessionToken = crypto.randomBytes(32).toString("hex");

  res.cookie("session_id", sessionToken, {
    httpOnly: true,       // cannot be read by JS
    secure: true,         // only sent over HTTPS
    sameSite: "strict",   // or "lax" depending on your UX needs
    maxAge: 1000 * 60 * 60 * 24, // optional: 1 day
  });

  return next();
});
A session token is generally passed in the HTTP Authorization header. Ideally, this should not be exposed in JavaScript (e.g., localStorage or sessionStorage), since data accessible to JavaScript is vulnerable to cross-site scripting (XSS).
Additionally, systems should monitor for the reuse of refresh tokens. If a refresh token is used more than once, it may indicate that the token was stolen. Such sessions should be considered compromised and cut off immediately.
Now that we've covered what user sessions are and how they're maintained, the rest of the article will explore how session data can be used in troubleshooting, performance monitoring, and development workflows.
User session recording for debugging and product improvement
For developers, an important aspect of user sessions is that they provide a structured trail of user activity. Consider the typical bug fix process: QA finds an instance of unexpected behavior, writes detailed instructions for reproducing the behavior, and provides those to a developer. The developer must follow those instructions to accurately reproduce the bug, troubleshoot, and fix it.
However, in many cases, the QA person who spotted the behavior is unable to reliably reproduce it. The problem may occur only under specific, not-yet-identified conditions, such as the first time a feature is used or when a race condition happens. In these cases, the tester often ends up repeating variations of the same steps to isolate the trigger before passing it to the developer.
In this context, a user session can serve as a structured record of a user's actions and state. Developers can examine session logs, request histories, or stored session data to piece together what happened during the user's interaction. Doing so typically involves sifting through logs and manually reconstructing event sequences to determine the application's state at each step.
Interact with full-stack session recordings to appreciate how they can help with debugging
EXPLORE THE SANDBOX(NO FORMS)
Using an effective session recording tool streamlines this process and saves time for both developers and testers. Consider using a recording tool like Multiplayer, which captures a user's interactions with a web application (clicks, inputs, navigation, etc.) and correlates them with DOM changes, network interactions, and backend traces. Each session recording preserves structured data that developers can use to reproduce and analyze issues as they occurred.


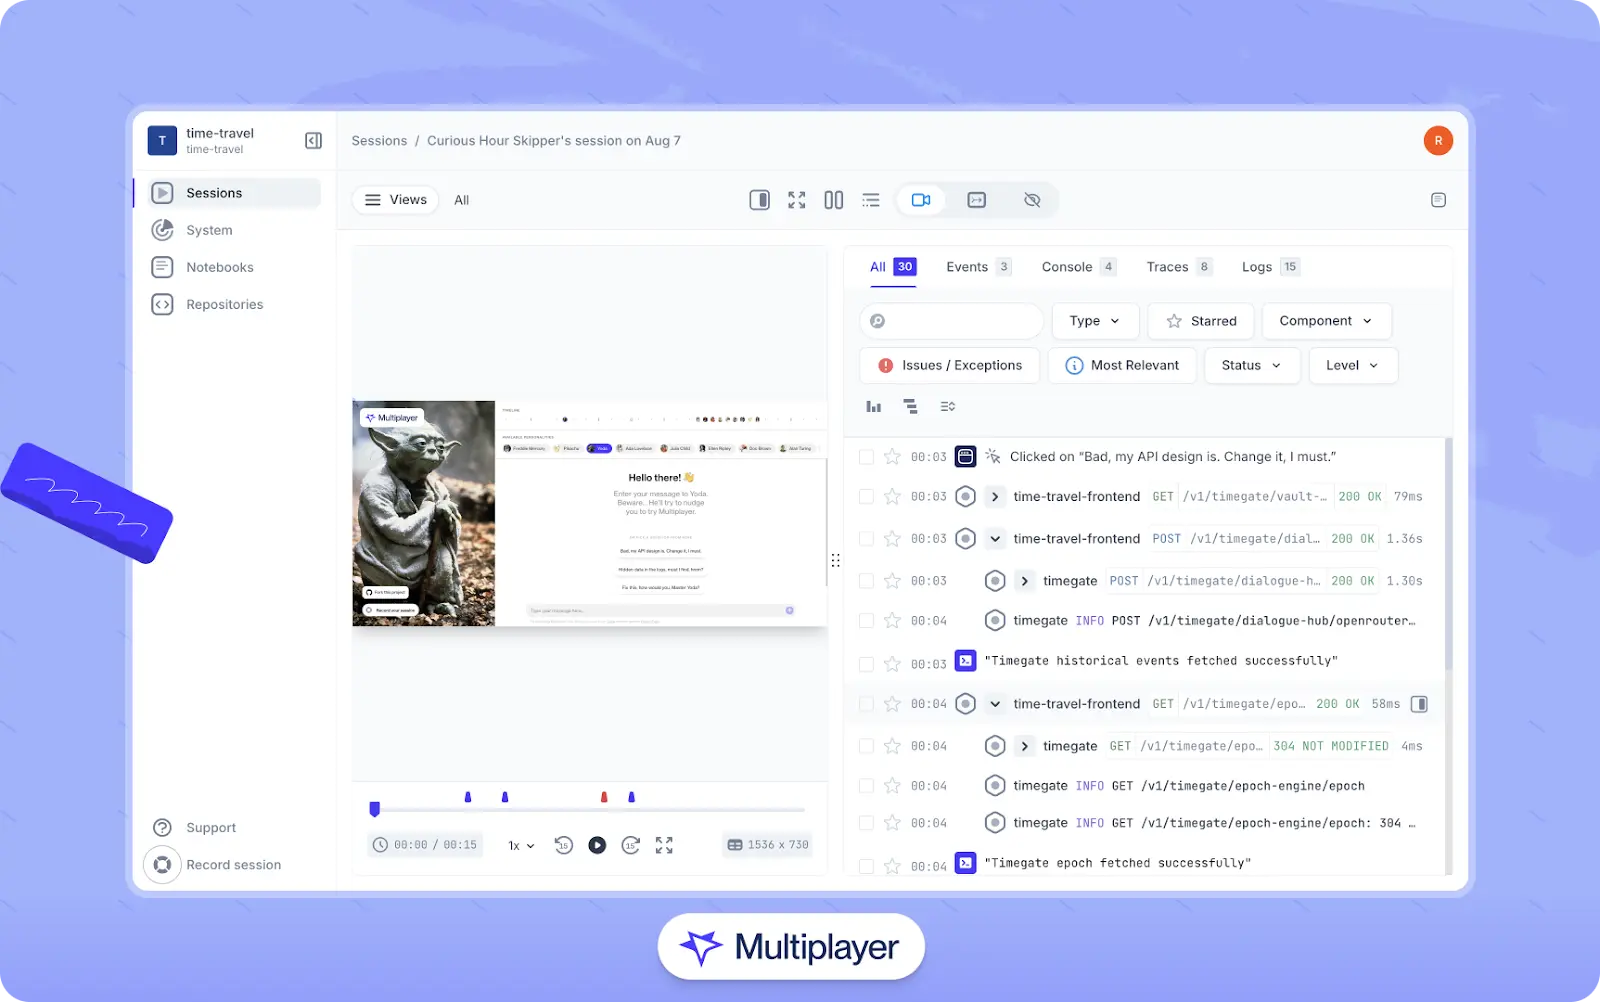
Multiplayer full stack session recordings.
Setting up session recording tools generally involves installing third-party session recording software that instruments the client-side application. For example, here is how to set up Multiplayer to collect frontend session data:
import SessionRecorder from '@multiplayer-app/session-recorder-browser'

SessionRecorder.init({
  application: 'my-web-app',
  version: '1.0.0',
  environment: 'production',
  apiKey: 'MULTIPLAYER_API_KEY',
  propagateTraceHeaderCorsUrls: [new RegExp('https://api.example.com', 'i')],
})

// add any key value pairs which should be associated with a session
SessionRecorder.setSessionAttributes({
  userId: '12345',
  userName: 'John Doe'
})
Once initialized, the session recorder automatically captures relevant client-side activity and associates it with the configured application metadata.
To correlate browser events with backend telemetry, trace context must be propagated from the browser to the server. A common approach is to instrument the backend with OpenTelemetry, which allows incoming requests to continue the client's trace context.
When properly configured, the browser SDK injects standard trace headers (such as the W3C traceparent header) into outbound HTTP requests. The backend OpenTelemetry instrumentation then picks up these headers and attaches server-side spans–such as request handling, database queries, and framework operations–to the same distributed trace.
This enables engineers to view frontend interactions and backend telemetry as a single, end-to-end flow. Additional diagnostic information, such as business-specific inputs or results, can be added to traces as needed to support deeper debugging and performance analysis.
Using such tools, a QA person can begin a recording, follow the steps to illustrate the behavior, and end the recording, whose URL can then be shared with a developer. The developer can replay the recording, view exactly what browser activity occurred, and inspect data passed to or from the server without sifting through logs or following a potentially complex set of reproduction steps.
Performance monitoring and troubleshooting
Monitoring user sessions also provides an essential window into how an application behaves in production by capturing telemetry data, including:
- Traces: End-to-end records of a request as it moves through the system. A trace consists of one or more spans and shows how different services and components contribute to total latency.
- Spans: Represent a single operation within a trace, such as a database query, API call, cache lookup, or function execution. Each span typically includes timing, status, and contextual metadata.
- Metrics: Measurements that reflect ongoing system performance and health, such as CPU usage, response time, memory, throughput, error rate, and latency.
- Logs: Discrete, timestamped records of events, warnings, or errors. Logs provide granular detail and are often used to diagnose failures or augment traces with additional context.
Telemetry can often become noise in a distributed environment. However, when this telemetry data is linked to a recorded session, it is possible to see what the user saw and connect that with the underlying system behavior. For instance, a replay might show a delay after the user clicked a button, while a trace shows that the delay is correlated with a slow database query on the server.
As mentioned previously, the most common way to collect telemetry is by instrumenting services with a framework like OpenTelemetry. Doing so allows applications to generate standardized traces, metrics, and logs that can be correlated across services and environments.
Common pitfalls when working with user session telemetry
When capturing telemetry data, several key considerations should be taken into account.
Improper handling of sensitive data
Instrumentation often interacts with sensitive data, making privacy a core concern. Engineers must take care to mask data that shouldn't be publicly visible. The OpenTelemetry documentation provides instructions for handling sensitive data, and the OpenTelemetry Collector's redaction processor can be used to scrub it before exporting it to the backend. When using a session recorder like Multiplayer, this process is automated and customizable out of the box.
Failure to correlate data across the stack
Another common problem is failing to correlate backend trace data with front-end events shown in the session replay. Trace IDs must be preserved across both sides of the system. You can confirm proper propagation by comparing the trace ID in the incoming request headers with the traceparent value in the browser's DevTools.
If the traceparent header is missing or doesn't match the backend trace, it typically means the server is generating a new trace rather than using the client's. In that case, ensure that your instrumentation reads and honors the incoming traceparent header rather than starting a new root span.
In the context of session recording, some tools automatically provide this correlation. For example, Multiplayer provides an exporter that receives frontend spans from its client libraries or Chrome browser extension and correlates them with backend traces from instrumented services.
One click. Full-stack visibility. All the data you need correlated in one session
RECORD A SESSION FOR FREEOverdependence on sampling
Sampling–the practice of collecting a smaller subset of data–is a powerful technique for controlling telemetry volume for broad strokes analysis. However, while sampling can provide sufficient data for statistically reliable performance analyses, sampling sessions recorded to inspect individual user journeys will create blind spots. To avoid this problem, tools such as Multiplayer capture session recordings without sampling so that all data is preserved for sessions under investigation.
AI workflows and automation based on user session data
The same telemetry and session data that facilitate performance monitoring can be used to feed AI workflows, which have a wide range of potential applications. While these workflows are still evolving, they illustrate practical ways session data can support more informed development and troubleshooting. Let's explore a few examples.
Understanding system behavior
Session data can be paired with source code to allow development tools to describe what happens on the backend during a session. A common method is to connect one's IDE with an MCP server, which allows session data to be retrieved via a chat agent. The backend processing can then be analyzed and described within the editor.
Debugging and optimization
AI tools can also analyze session telemetry to provide code insights and recommendations to optimize performance. For example, because spans record exact timing, relationships, and execution paths, they can reveal patterns like redundant API calls, slow or inconsistent backend functions, or endpoints that return far more data than the frontend requires.
AI tools can surface these patterns automatically, highlight the portions of code most likely responsible, and suggest targeted improvements. In addition, using the trace ID that the frontend sends to the backend, telemetry spans can be matched with user events in the browser so that AI tools can correlate a user action with the backend code it triggered.


Debugging using a session recording in the Cursor IDE
Feature development and validation
Session data shows how users actually engage with a feature: what paths they take to reach it, how they interact with it, whether they complete the intended workflow, and which bugs are triggered. In this context, analyzing user sessions can help teams in two important ways.
First, frontend recorders or other UX-centric tools provide insights into user behavior and reveal where users hesitate, make errors, or abandon workflows. AI tools can aggregate these sessions to highlight unexpected usage patterns, user confusion, or paths users follow that lead to abandoning the feature entirely.
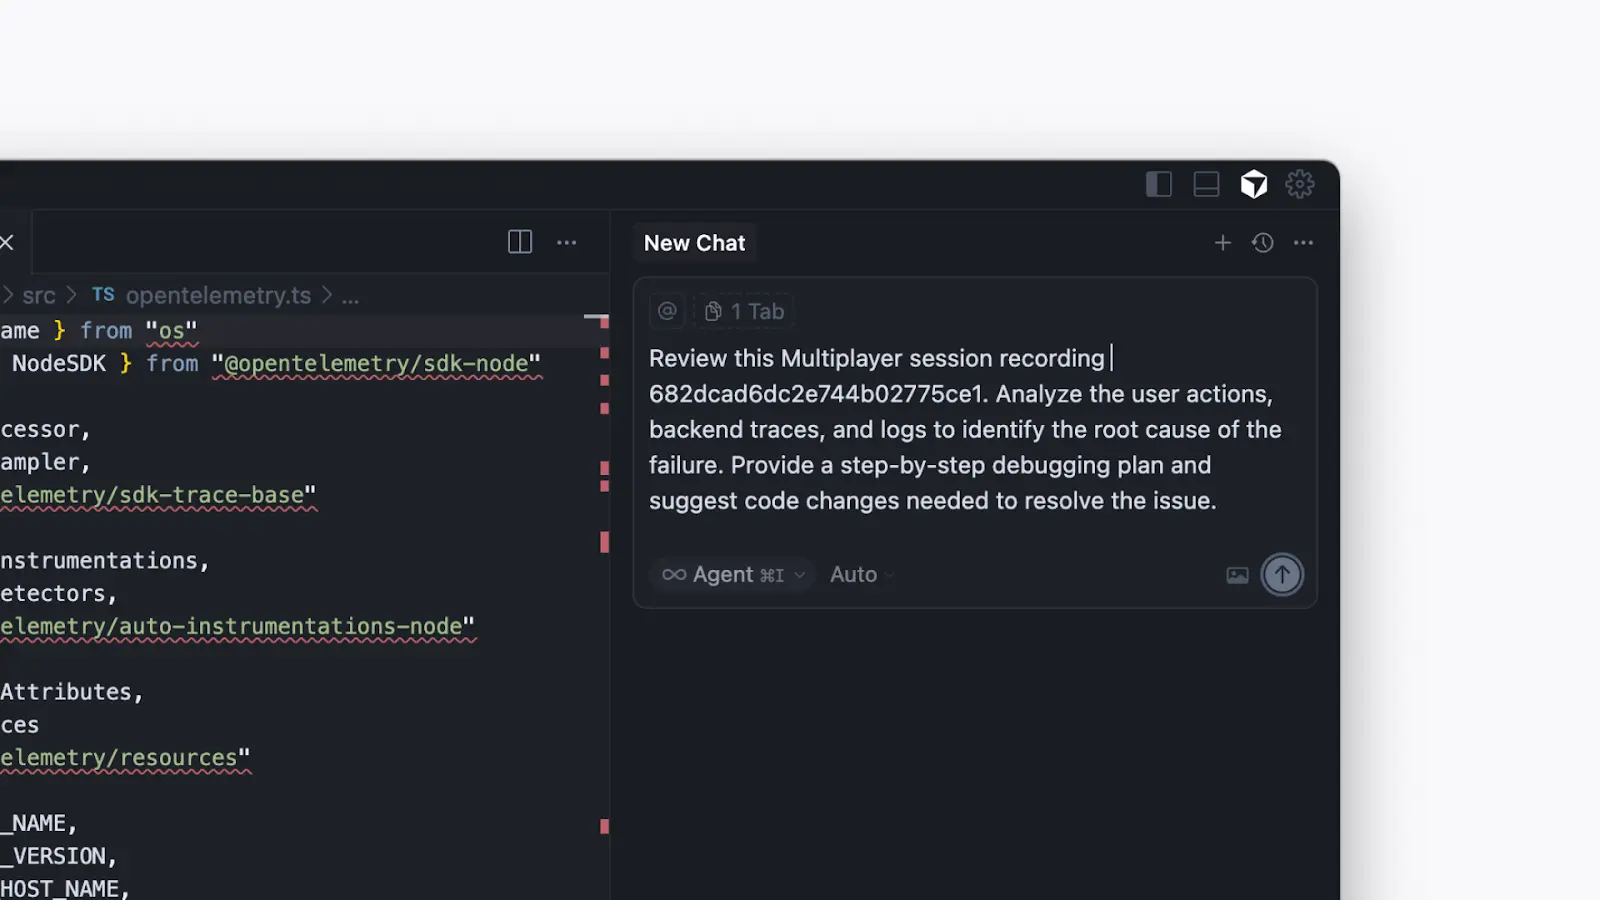
Second, developer-centric, full-stack session recorders help engineers validate features in staging environments and uncover issues before they reach users. Data from full-stack recorders can be fed to AI tools to identify performance bottlenecks, detect inefficient code paths, or create development plans for new features.

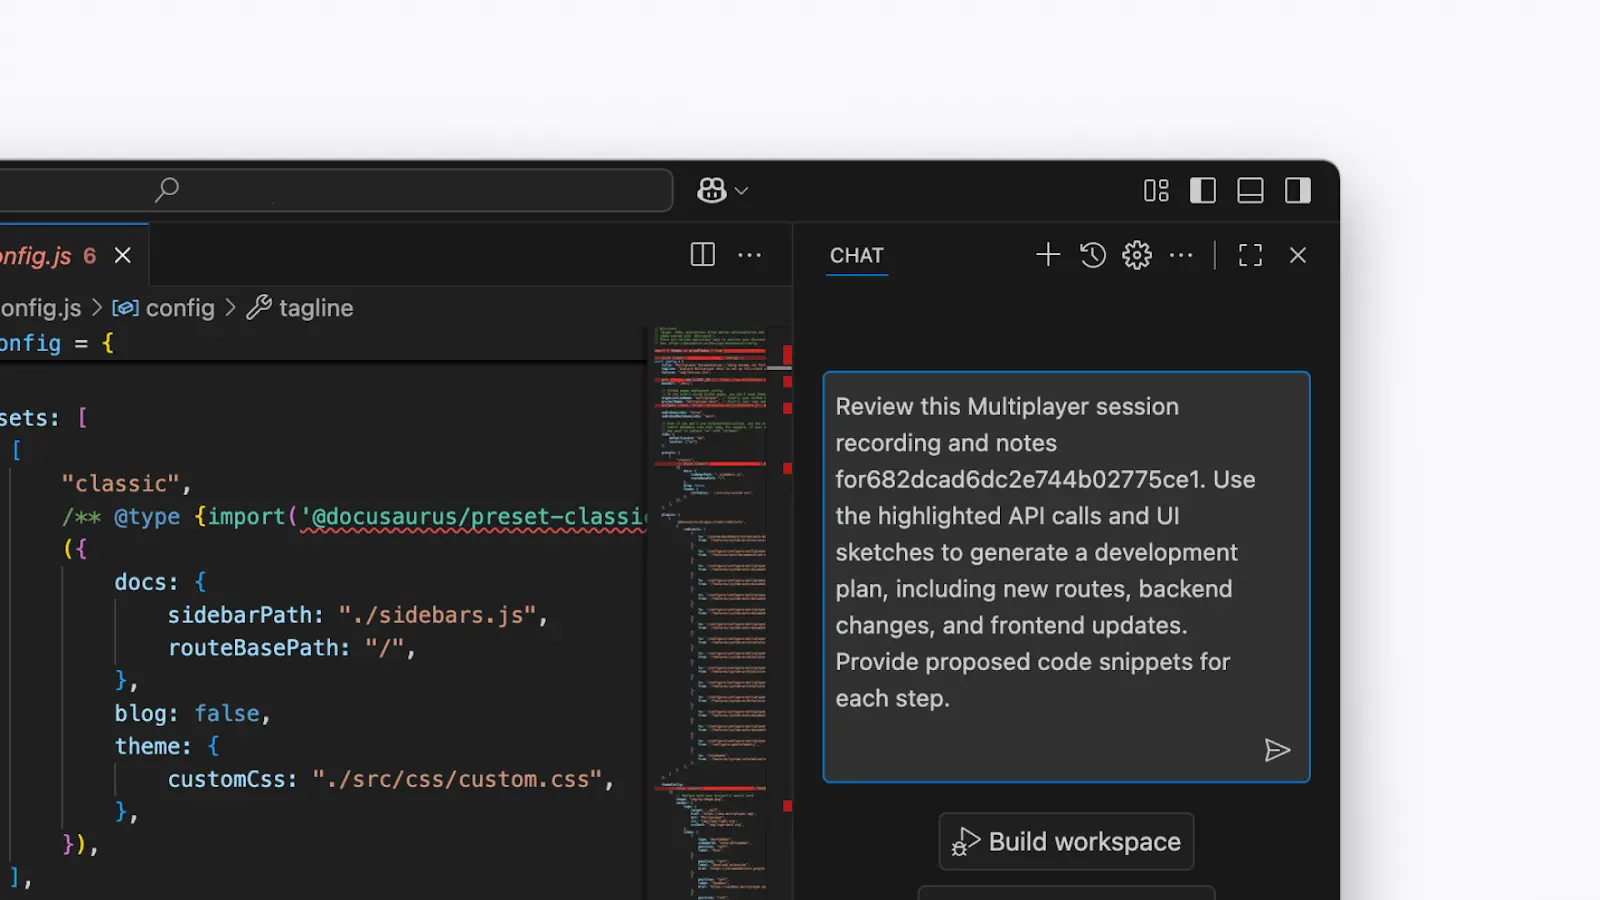
AI-assisted feature development in the VS Code IDE
Automated documentation
Some tools can transform a session recording into developer-friendly documentation. For example, platforms like Multiplayer can generate interactive notebooks that walk step-by-step through what happened during a session. These notebooks highlight the API calls involved and include descriptive explanations produced by an AI agent. This provides developers with a clear, automatically generated narrative of how a feature behaved during real use.

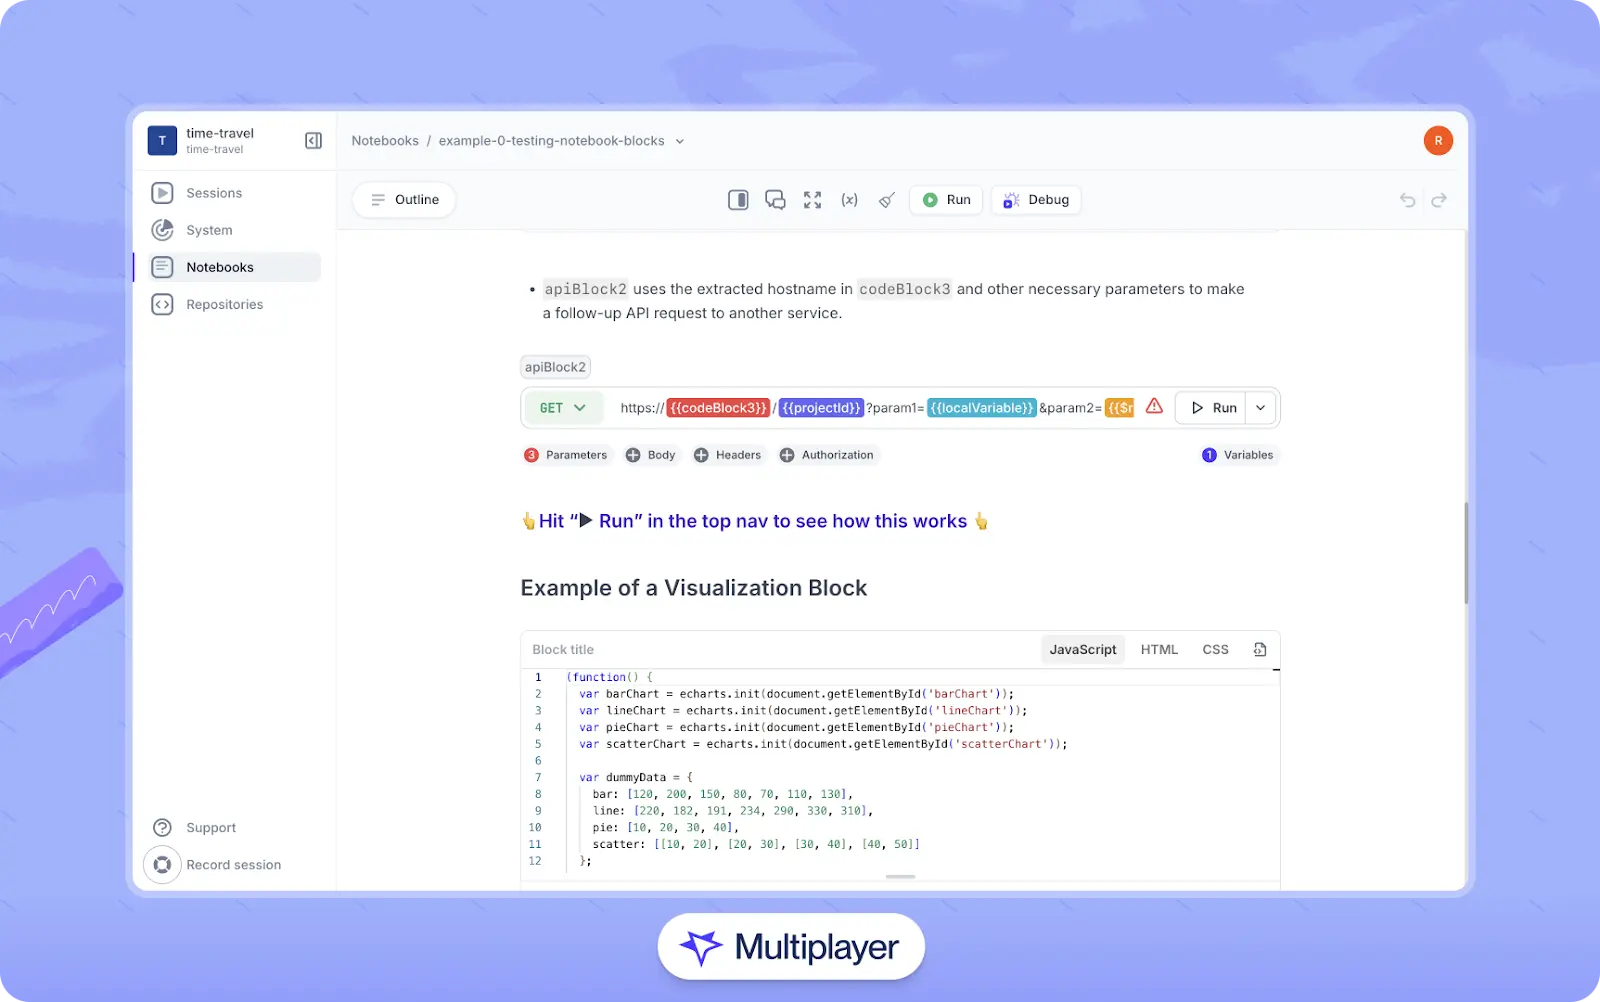
Multiplayer notebooks
Regression testing
The goal of regression testing is to ensure recent bug fixes or added features haven't broken existing behavior. Ordinarily, a developer will write the code for a series of specific tests that, when run successfully, confirm that the app or API performs as expected.
Stop coaxing your copilot. Feed it correlated session data that’s enriched and AI-ready.
START FOR FREEModern developer tools can import session data and build regression tests based on a session's recorded behaviors. For instance, developers can integrate VS Code with MCP servers to retrieve session data from a session recorder. Next, using an AI tool like GitHub Copilot, they can request a list of recorded sessions, select a session ID, and direct the agent to generate and run regression tests for the API calls used during that user session.


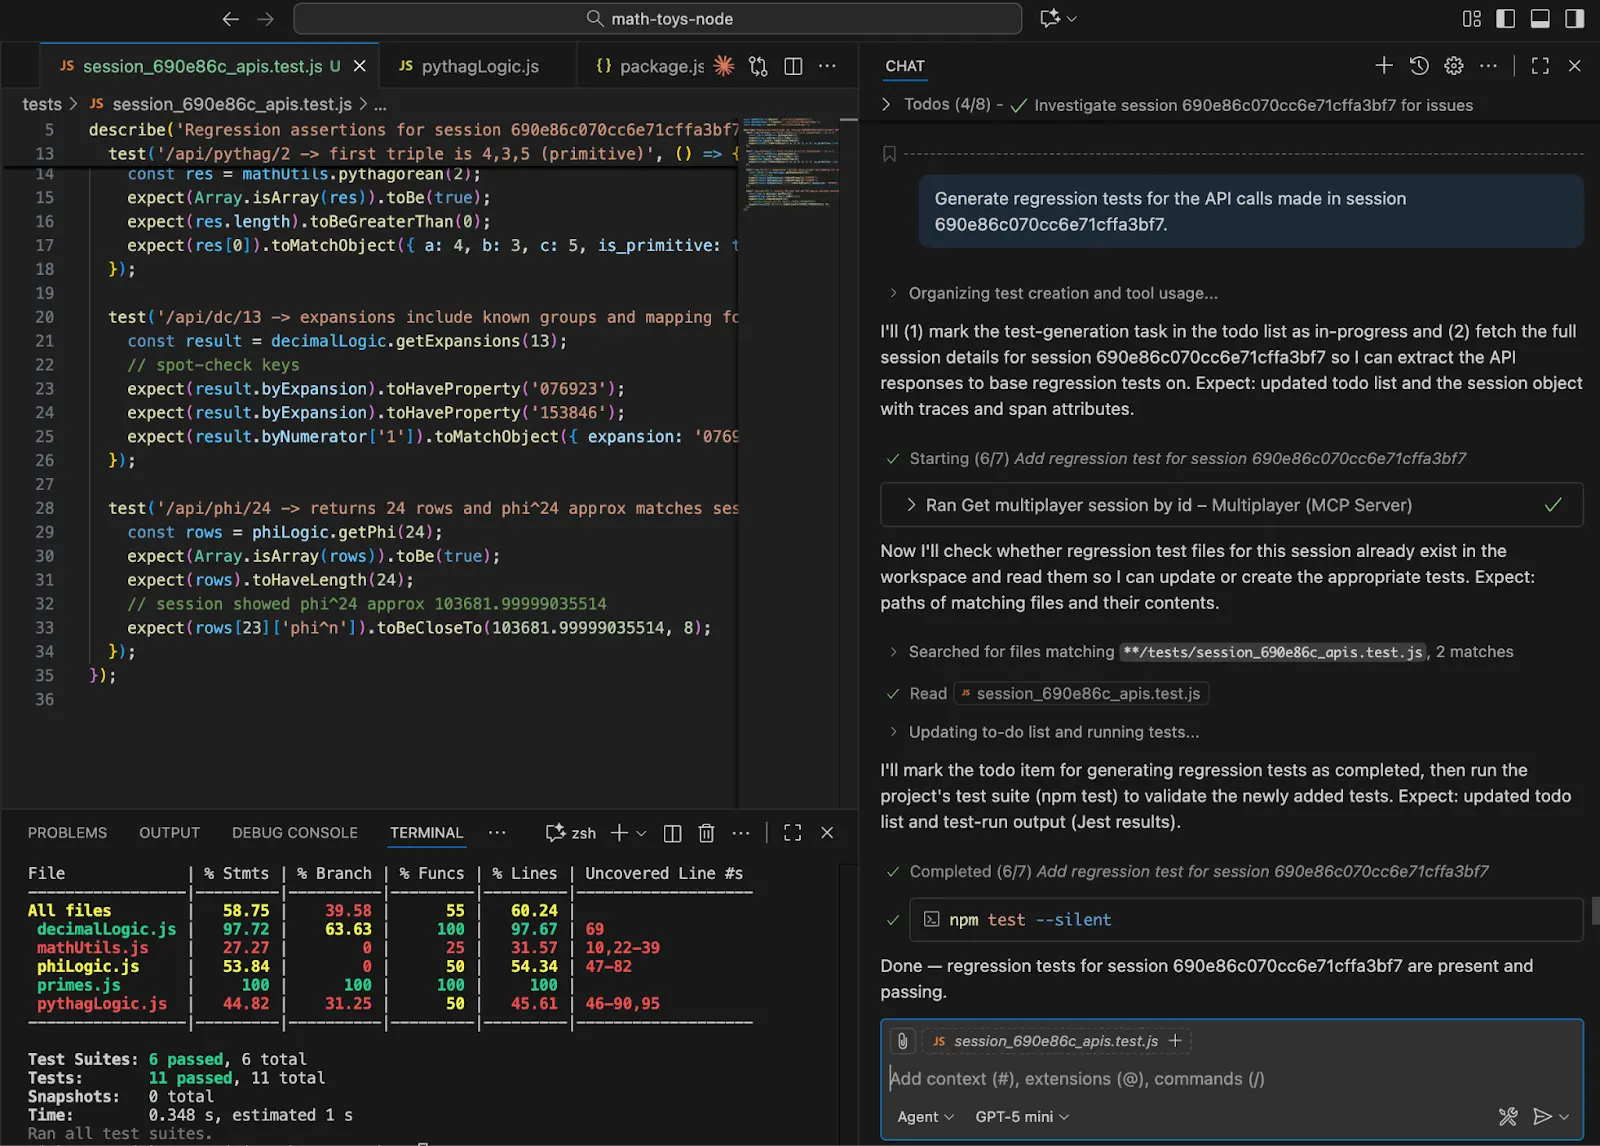
Generating regression tests with AI assistance
With the development tool aware of the recorded session data, the developer can request insights into potential problems in the session, such as duplicate calls and telemetry mismatches, and decide what actions, if any, to take. Additionally, tools like Multiplayer can automatically create runnable test scripts from a full-stack session recording to streamline the regression testing process.
Last thoughts
User sessions allow applications to maintain continuity across the stateless HTTP protocol that powers the web. Whether a user is logged in or interacting anonymously, a record of their activity provides context for understanding both user experience and system behavior. Organizations that properly instrument their services and leverage session data can improve usability, optimize performance, enhance reliability, and support AI-driven workflows to make development and troubleshooting more efficient.