Guide
OTel Collector: Best Practices & Examples
Table of Contents
OpenTelemetry (OTel) has emerged as a leading open-source and vendor-neutral observability platform at a time when distributed applications based on microservices rely more than ever before on observability. OTel facilitates generating metrics, traces, and logs across various services and runtimes and helps teams gain consistent visibility across their stacks.
The key to a strong OTel-based observability pipeline is the OTel Collector, which ingests, processes, and exports telemetry data. Properly configuring the Collector can significantly improve your observability environment's performance, cost, and value. However, doing so is not trivial. The Collector is built on a modular architecture of receivers, processors, exporters, and extensions for flexibility, but with that flexibility comes complexity. Misconfigurations can result in dropped data, increased latency, or unnecessary resource consumption.
In this article, we describe several best practices for configuring the OpenTelemetry Collector to avoid common issues and build a robust, efficient, and secure observability pipeline.
Summary of key OTel Collector best practices
The table below summarizes the best practices for configuring each OTel Collector’s core components.
| Best practice | Description |
|---|---|
| Choose appropriate processor logic | Processors can help optimize telemetry data before exporting to a backend, reducing network and storage costs while improving efficiency. |
| Prioritize security | Implement TLS encryption, enable Collector authentication, and sanitize telemetry data before exporting to prevent unauthorized access. |
| Optimize receiver configuration | Enable only the necessary receivers to reduce resource consumption and improve performance. |
| Efficiently export to the desired backend | Choose the right exporter for your use case and enable compression as required to reduce bandwidth consumption. |
| Monitor the Collector | Continuously track Collector health to detect performance downgrades and dropped telemetry data. |
| Integrate with appropriate tooling | Enhance OpenTelemetry capabilities by integrating with third-party tools to improve observability, collaboration, and developer efficiency. |
Choose appropriate processor logic
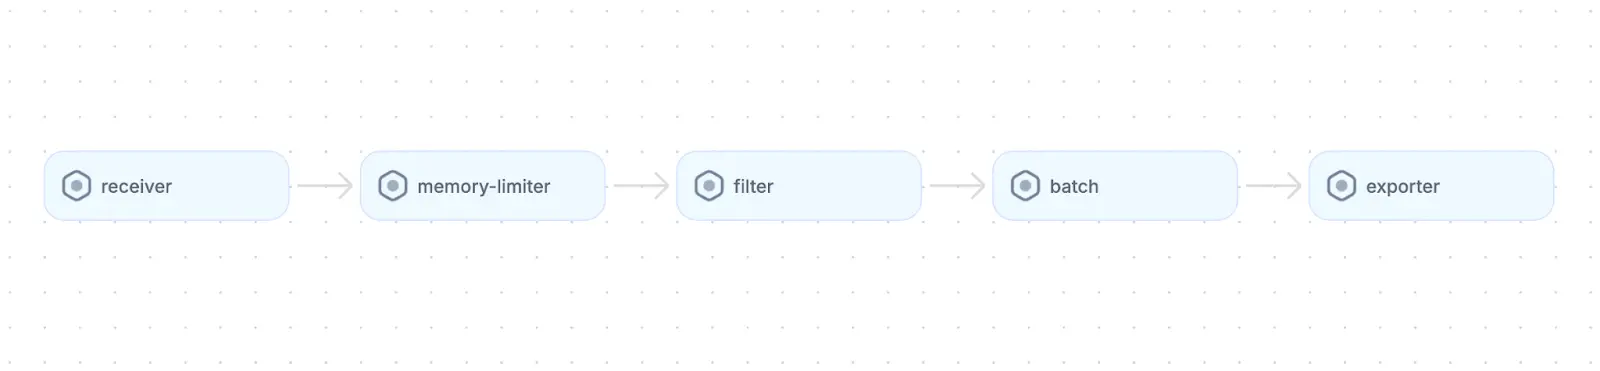
Processors work together to shape and optimize telemetry data before it is exported. Configuring processors like batch and memory_limit can help prevent system overload and improve storage efficiency. Other processors, such as filter and attributes, can help sanitize the telemetry data by removing sensitive fields or tagging data..
Here’s an example flow diagram of a typical processor pipeline:


When working with services that produce thousands of spans per second, it is important to account for the following scenarios:
- The Collector may crash under high traffic.
- The backend could be flooded with irrelevant or low-value data.
- Masking or removing PII and enriching data with context is often necessary for compliance.
You can address these challenges by configuring a pipeline with the following processors:
memory_limiter:Ensures stable performance under high load by limiting memory usagebatch:Groups telemetry to optimize network performance and improve throughputfilter:Drops noisy or unnecessary spans to improve storage efficiencyattributes:Enriches data with contextual information or redact sensitive fields before exporting
Here’s an example processor pipeline:
processors:
 batch:
   send_batch_max_size: 1000
   timeout: 10s

 memory_limiter:
   check_interval: 1s
   limit_mib: 1024
   spike_limit_mib: 512

 filter/ottl:
  error_mode: ignore
  traces:
    span:
      - 'attributes["http.status_code"] >= 400'
    spanevent:
      - 'attributes["grpc"] == true'
  metrics:
    metric:
      - 'name == "cpu.usage" and resource.attributes["host"] == "ec2-host-1"'
  logs:
    log_record:
      - 'severity_text == "DEBUG"'

 attributes:
  actions:
    - action: add
      key: environment
      value: production
This pipeline batches telemetry for efficient export, limits memory usage to prevent overload, filters out noisy or low-value data (such as debug logs and specific error spans), and enriches outgoing data with an environment=production tag for downstream analysis and filtering.
Prioritize security
Telemetry data can contain sensitive application information. Implementing security practices such as TLS encryption, collector authentication, and redacting sensitive data helps protect against tampering or leaks.
TLS encryption
Encrypting data in transit between telemetry sources, collectors, and backends prevents packet sniffing or man-in-the-middle attacks. This can be done by practicing certificate rotation at regular intervals and ensuring that the certificates come from trusted certificate authorities (CAs).
The following example receiver configuration shows how you can use a custom certificate for enabling TLS encryption:
receivers:
 otlp:
   protocols:
     grpc:
       endpoint: 0.0.0.0:4317
       tls:
         cert_file: cert.pem
         key_file: cert-key.pem
Set up Collector authentication
Configure the Collector to use tokens or mTLS to authenticate and verify requests that push telemetry data into and out of the Collector. Leverage dynamic token issuance to improve the security of the tokens by using tools like AWS Secrets Manager or Hashicorp Vault.
Let’s look at a token-based authentication setup:
extensions:
  bearertokenauth:
    token: ${BEARER_TOKEN} # fetched via env or secret manager

exporters:
  otlp/withauth:
    endpoint: 0.0.0.0:8000
    ca_file: /tmp/certs/ca.pem
    auth:
      authenticator: bearertokenauth
Note that to use bearertokenauth, you need to enable TLS on the exporter.
Full-stack session recording
Learn more


Redact sensitive data
As we saw in the previous section, processors can help remove sensitive information from telemetry data. Utilize the attributes processors to remove or mask PII before forwarding data to third-party services.
Consider the following attributes processor configuration:
processors:
 attributes:
   actions:
     - action: delete
       key: user.email
     - action: mask
       key: user.name
       value: "REDACTED"
In this setup, the field user.email is removed entirely, while user.name is replaced with a “REDACTED” placeholder to prevent the exposure of identifiable information. Other possibilities include replacing sensitive values with custom tokens, hashing data for pseudonymization, or selectively redacting only parts of a field using regular expressions. You can also use attribute actions to rename keys, convert data types, or add context tags that help other systems interpret the sanitized data correctly.
Optimize the receiver configuration
Receivers collect telemetry data from various sources and can be configured to optimize performance and resource utilization. They operate in two main modes:
- Push-based, where they accept telemetry actively sent from instrumented services or agents
- Pull-based, where they periodically scrape or poll endpoints to gather telemetry data
In addition, receivers can support multiple data sources simultaneously. Let’s take a look at three common receivers.
OTLP
The OpenTelemetry Protocol (OTLP) receiver is the most commonly used receiver to send telemetry data—such as traces, logs, and metrics—to the Collector. It supports the gRPC and HTTP protocols on configurable ports.
Here’s an example OTLP receiver configuration with gRPC and HTTP protocols:
receivers:
 otlp:
   protocols:
     grpc:
       endpoint: 0.0.0.0:4317
       tls:
         cert_file: cert.pem
         key_file: cert-key.pem
     http:
       endpoint: 0.0.0.0:4318
This configuration enables the OTLP receiver to accept telemetry data over gRPC on port 4317 with TLS encryption enabled and over HTTP on port 4318 without TLS. The setup allows clients to securely send data via gRPC while also supporting HTTP-based ingestion where needed.
Prometheus
The Prometheus receiver facilitates scraping metrics from Prometheus-compatible endpoints. For example, the following receiver configuration can be used to scrape the target every 5 seconds for metrics:
receivers:
 prometheus:
   config:
     scrape_configs:
       - job_name: 'services'
         scrape_interval: 5s
         static_configs:
           - targets: [0.0.0.0:8888]
The Prometheus receiver is commonly used within legacy systems or services that already expose Prometheus metrics without additional instrumentation.
Interact with full-stack session recordings to appreciate how they can help with debugging
EXPLORE THE SANDBOX(NO FORMS)
Kafka
The Kafka receiver allows the Collector to consume telemetry data from Kafka topics. This can be useful for distributed systems with message queues. The receiver can ingest traces, metrics, or logs that have been published to Kafka. For example:
receivers:
 kafka:
   auth:
     tls:
       insecure: false
   topic: otel-traces
   brokers:
    - kafka:9092
Note that using secure authentication and TLS options (as above) helps ensure data integrity and confidentiality when connecting to Kafka brokers.
Efficiently export to the backend
Exporters send the processed telemetry to your desired backend. Like receivers, exporters can also be pull- or push-based. Choose the right exporter for your use case and enable data compression, if required, to minimize bandwidth consumption.
The following table compares the most commonly used exporters:
| Exporter | Use case | Protocol | Compression | Considerations |
|---|---|---|---|---|
| OTLP/gRPC | General low-latency, high-throughput environments | gRPC | Optional | Requires bidirectional streaming support |
| OTLP/HTTP | Simple integrations and edge environments | HTTP | Gzip (default) | Easier proxying and firewall traversal; supports multiple backends |
| Promtheus | Metrics scraping for dashboards or alerts | Pull | N/A | Only exports metrics that Prometheus can scrape |
| Kafka | High-scale async ingestion and decoupling | Push | Snappy | Good for large-scale or streaming architectures |
Choosing the right exporter typically boils down to weighing tradeoffs between throughput, latency, network reliability, and compatibility with your backend systems. High-throughput environments often benefit from gRPC-based exporters for their efficient streaming capabilities, while simpler HTTP exporters may be preferred in edge or proxy-heavy deployments.
Monitor the Collector
Monitoring the Collector’s health can be essential for an optimized observability infrastructure, as keeping track of Collector health can help cut down data loss and performance degradation. The Collector provides multiple built-in mechanisms for comprehensive monitoring,
Health checks
Configure the health check extension to verify the Collector’s status frequently.
extensions:
  health_check:
    endpoint: "0.0.0.0:13133"  # default endpoint

service:
  extensions: [health_check]
Expose integral metrics
The Collector emits internal metrics that provide deep insights into its performance. Monitoring key metrics (such as memory and CPU utilization, otelcol_exporter_sent_spans, and otelcol_receiver_accepted_spans) and configuring alerts can help identify potential issues.
receivers:
  prometheus:
    config:
      scrape_configs:
        - job_name: 'otel-collector'
          static_configs:
            - targets: ['localhost:8888']
Integrate with appropriate tooling
When paired with suitable tools, OpenTelemetry data provides valuable insights into system architecture and service dependencies. For example, tools like Grafana and Jaeger are widely used to visualize metrics and traces. A typical Grafana configuration might scrape application metrics and export them to Prometheus for dashboarding and alerting:
receivers:
  prometheus:
    config:
      scrape_configs:
        - job_name: 'app-metrics'
          static_configs:
            - targets: ['0.0.0.0:9100']

exporters:
  prometheusremotewrite:
    endpoint: "http://prometheus-server:9090/api/v1/write"

service:
  pipelines:
    metrics:
      receivers: [prometheus]
      exporters: [prometheusremotewrite]
Jaeger might utilize the Collector to receive, process, and export trace data from instrumented services. The Collector can batch incoming traces, apply sampling policies to reduce data volume, and then forward the processed data to the Jaeger backend for storage and visualization.
One click. Full-stack visibility. All the data you need correlated in one session
RECORD A SESSION FOR FREEreceivers:
otlp:
protocols:
grpc:
endpoint: 0.0.0.0:4317
processors:
batch:
tail_sampling:
decision_wait: 30s
policies:
- name: error_traces
type: status_code
status_code: error
exporters:
jaeger:
endpoint: "jaeger-collector:14250"
tls:
insecure: true
service:
pipelines:
traces:
receivers: [otlp]
processors: [batch, tail_sampling]
exporters: [jaeger]Finally, tools like Multiplayer can use telemetry data to facilitate a range of features, such as generating real-time architecture diagrams and capturing full-stack session recordings, which correlate frontend user interactions with backend traces, logs, and metrics to aid in debugging and feature development.


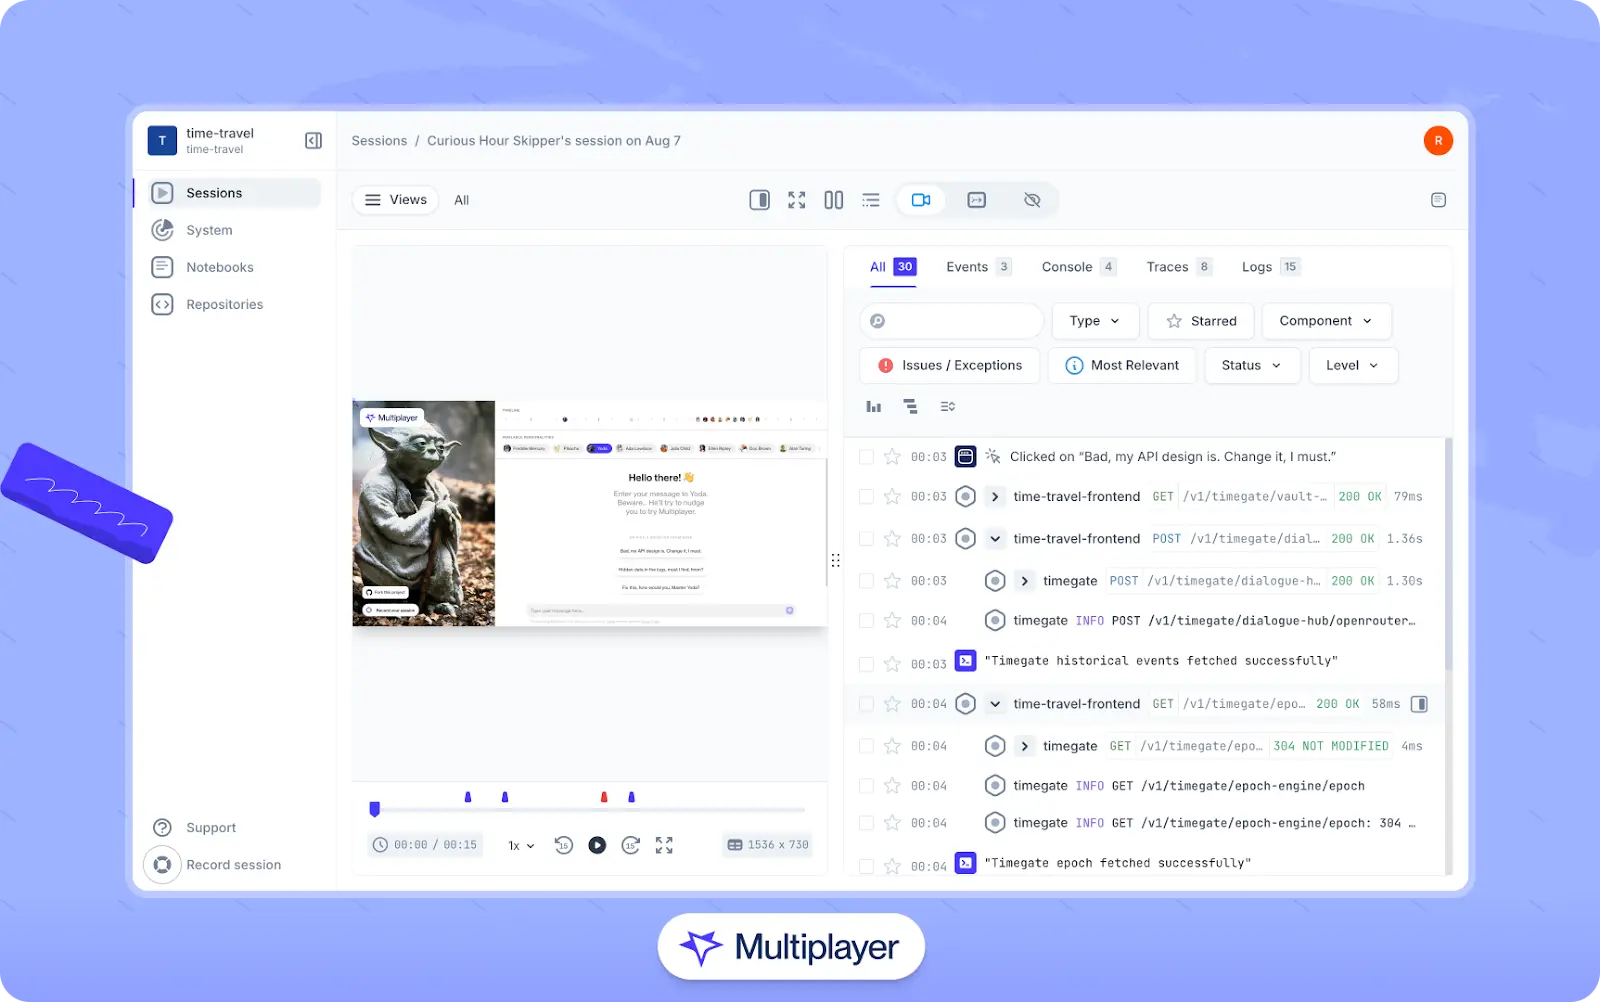
Multiplayer’s full-stack session recordings
Putting it all together
Now that we’ve explored the key components and best practices, let’s look at how they work together in a real-world configuration. The example below features an OTLP input, Prometheus scraping, memory limiter, batching processors, and a Multiplayer exporter:
receivers:
 otlp:
   protocols:
     grpc:
       tls_settings:
         cert_file: "/etc/otel/certs/cert.pem"
         key_file: "/etc/otel/certs/key.pem"
     http:

 prometheus:
   config:
     scrape_configs:
       - job_name: 'test-service'
         static_configs:
           - targets: ['localhost:9090']

processors:
 memory_limiter:
   check_interval: 5s
   limit_mib: 200
   spike_limit_mib: 50

 batch:
   timeout: 5s
   send_batch_size: 512

 attributes:
   actions:
     - key: user.password
       action: delete

exporters:
 otlphttp/multiplayer:
   endpoint: https://api.multiplayer.app
   headers:
     Authorization: "<YOUR_AUTH_TOKEN>"

 prometheus:
   endpoint: "0.0.0.0:8889"

extensions:
 health_check:
   endpoint: "0.0.0.0:13133"

service:
 telemetry:
   metrics:
     address: ":8888"

 extensions: [health_check]

 pipelines:
   traces:
     receivers: [otlp]
     processors: [memory_limiter, batch, attributes]
     exporters: [otlphttp/multiplayer]

   logs:
     receivers: [otlp]
     processors: [memory_limiter, batch]
     exporters: [otlphttp/multiplayer]

   metrics:
     receivers: [prometheus]
     processors: [memory_limiter, batch]
     exporters: [prometheus]
In this configuration, the OpenTelemetry Collector receives OTLP data over secured gRPC/HTTP protocols and scrapes metrics via Prometheus. It uses memory limiting, batching, and attribute filtering to process telemetry efficiently. Data is then exported to Multiplayer and Prometheus endpoints. Health checks and internal metrics endpoints support observability, and dedicated pipelines manage traces, logs, and metrics independently.
Stop coaxing your copilot. Feed it correlated session data that’s enriched and AI-ready.
START FOR FREEConclusion
OpenTelemetry offers a vendor-neutral approach to gathering telemetry that is needed for monitoring and maintaining fault-tolerant distributed systems. The OpenTelemetry Collector can be a foundation for a robust, production-grade observability stack.
To ensure security, always use TLS or mTLS on receivers and exporters, authenticate sources, and store secrets securely. For stability, optimize your pipelines with batching, memory limits, and early data filtering; configure exporters with retries, queues, and compression to ensure reliable delivery. It is important to monitor the Collector itself by exposing health checks and metrics, scraping its Prometheus endpoint, and setting up alerts based on internal telemetry.
Finally, enhance your observability stack with tools like Multiplayer, which integrate via OTLP exporters to automatically generate system documentation and create full-stack session recordings, helping your team make actionable insights from telemetry data.