Guide
Session Recording: Tutorial & Use Cases
Table of Contents
Web applications are becoming increasingly complex, which means that debugging them may involve stepping through several layers of frontend interfaces, backend services, APIs, and user interactions. Session recording allows developers to review issues in a structured, replayable format. Unlike a regular screen recording that creates a video, a session recording also captures actionable data, such as Document Object Model (DOM) changes, user events, network requests, and console logs. This data allows engineers to debug issues more accurately and follow them through the entire stack.
Session recording tools fall into two broad categories:
- UX-centric tools are optimized for user behavior and analytics. They typically include features like heatmaps, clicktracking, and conversion funnels to help product teams understand user flows, but they typically do not capture the detailed information developers need to diagnose system issues.
- Developer-centric tools record console logs, network calls, and backend traces to allow teams to follow requests through the entire stack to diagnose technical defects such as frontend rendering bugs, API failures, performance issues, or problems with event handling.
In this article, we explore how to utilize developer-centric session recording in your daily work through four scenarios: frontend debugging, isolating backend and API bugs, cross-browser testing, and new feature development. Each section will illustrate best practices, common mistakes, and example workflows that can be directly transferred to a variety of projects.
Summary of key session recording concepts and scenarios
| Development scenario | How session recording can help |
|---|---|
| Frontend debugging | Pinpointing rendering or interaction issues by replaying user steps |
| Tracing backend or API errors | Diagnosing errors by mapping API responses directly to user interactions |
| Cross-browser testing | Identifying environment-specific inconsistencies using session recordings to reproduce issues and capture metadata |
| New feature development | Observing real usage of new functionality to validate assumptions and get edge cases |
Frontend debugging
One of the most challenging aspects for engineers attempting to debug frontend issues is recreating the problem exactly as the user experienced it. A vague bug report like "the button didn't work" is rarely sufficient information. However, with the assistance of session recording, engineers can record event firings, DOM mutations, and console logs exactly as they occurred during the session.
Here is a sample timeline diagram of how a session recording captures frontend debugging events:


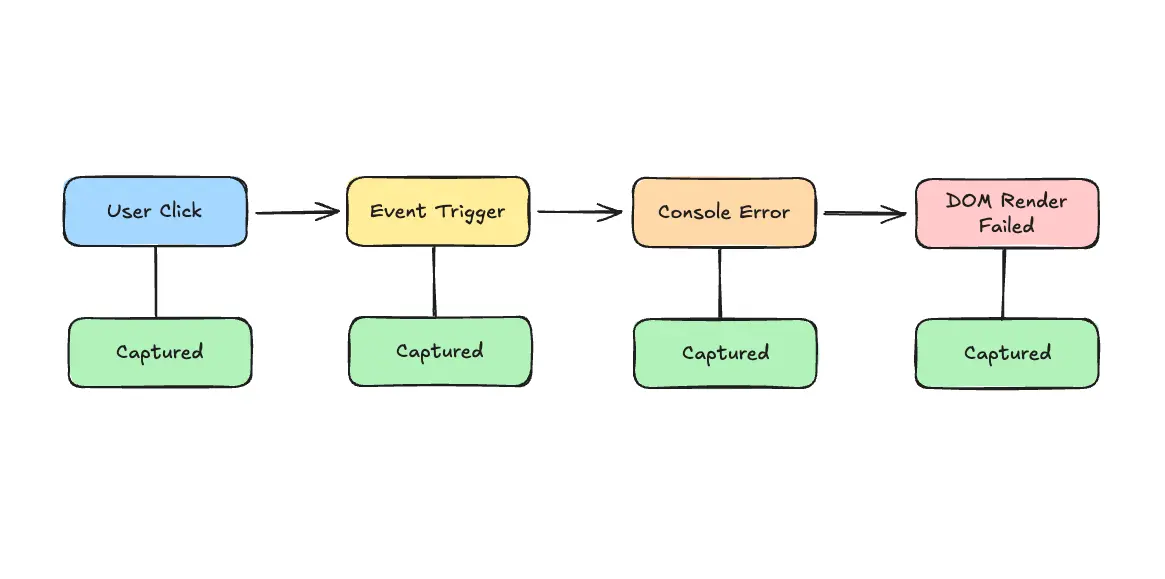
Session recording timeline diagram
A typical workflow using a traditional session recording tool is to replay the session while inspecting the website with a web browser's developer tools in another tab. By doing so, you can correlate a user's click with the JavaScript event, inspect the DOM state at that moment, and cross-reference CSS rules. For example, to debug a non-responsive button click using Chrome DevTools and a traditional session replay tool, you can follow this sequence:
- Pause the replay at the moment a user clicks on the button in the session replay tool.
- Open a new browser tab (or a browser window if the session replay is a desktop app), navigate to the page where the issue occurs, and open Chrome DevTools.
- Inspect the DOM structure in the Elements panel.
- Check the Console tab for errors or missing event listeners.
- Review the applied CSS rules in the Styles panel to confirm that the element's visibility, positioning, or other styling rules are not preventing interaction.
This workflow becomes more straightforward using modern session recording tools, which automatically preserve the exact console output, DOM state, and network activity from the original session and display this context alongside the replay. However, you may need to follow a similar workflow of context-switching between tools and browser tabs when investigating how the backend correlates to the frontend behaviour.
The last generation of session replay tools like Multiplayer record correlated user interactions, DOM snapshots, console logs, network requests, and backend traces for a single session. This more complete context reduces guesswork, since engineers can step through the session with the same visibility they would have had in a live debugging environment.


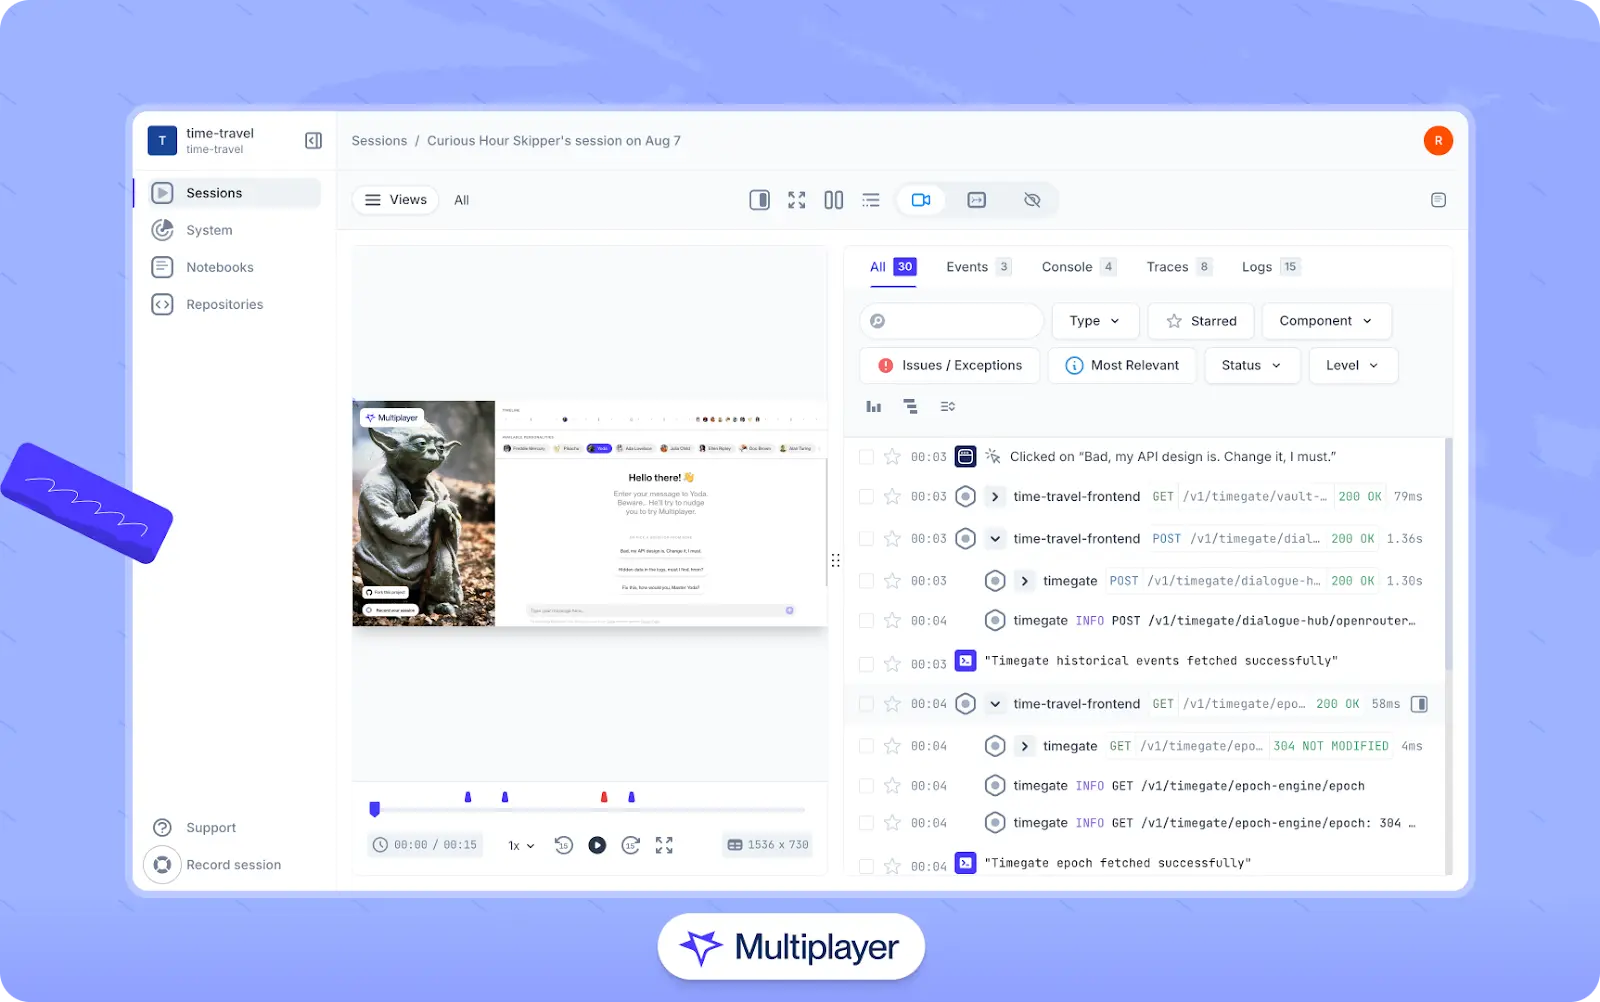
Multiplayer full stack session recordings
Once a session has been replayed and examined, developers should isolate patterns and exceptions that indicate latent faults. Many teams get caught by treating session recordings as regular videos and watching only "happy-path" sessions, which wastes these tools' technical potential and often masks real defects.
Instead, concentrate on error sessions where root causes are most likely to reveal themselves. Filter sessions for those with uncaught exceptions or console errors. For instance, a team investigating sporadic failures of a "Save" button might discover that across hundreds of recorded sessions, only a handful show a "TypeError: cannot read properties of undefined" message at the moment the button is clicked. Reviewing just these error-tagged sessions focuses attention on the actual defect instead of replaying non-problematic runs. In addition, attaching such filtered recordings directly to GitHub or Jira tickets ensures that QA and developers are referencing the same reproducible evidence of the issue.
Full-stack session recording
Learn more


Backend and API failures
Defects caused by backend service and/or API failures are often less visible and more difficult to correlate with user actions. A UI error may surface as a vague "something went wrong" message while the root cause lies deep in a failing service call or upstream dependency. Without session recording, debugging these issues typically involves a lot of manual correlation work. Developers might dig through backend logs to find failing requests, rely on partial error reports from monitoring tools, or attempt to reproduce the issue locally by mimicking user inputs.
Because session recording tools capture network requests and API responses as users interact with the application, much of this manual work can be avoided. Engineers can track requests from the frontend through API gateways and backend services using unique correlation IDs, then filter sessions by error code or anomalous behavior type to isolate failing interactions. Next, they can play back request-response flows to pinpoint the source of issues, verify backend error handling, and observe the complete sequence of dependent calls across services.
When following this process, it is important to consider security and compliance risks specific to your industry. Recording full request or response payloads often means capturing and storing sensitive customer information, such as PII, financial data, or authentication tokens. While it is possible to manually obfuscate or anonymize sensitive fields before storing or logging them, a safer and more straightforward approach is to simply choose a tool that provides this functionality out of the box. Doing so ensures data safety and consistent compliance with regulations like GDPR, HIPAA, or PCI.
Cross-browser testing
Every application behaves differently depending on the browser or device being used. A perfectly functional app may run flawlessly in Chrome but break in other browsers like Microsoft Edge or Safari. Similarly, there may be mobile-specific issues that never appear during desktop testing. Session recording assists in debugging these problems by providing reproducible proof of these inconsistencies, capturing exact workflows across browsers and devices. Here's how this can look in practice, step by step.
Step 1: Record a user session
When a bug is discovered (during QA, by support, or during manual testing), record a session replay that includes the following information:
- The user's browser, OS, device, and screen dimensions
- The UI interactions (clicks, scrolls, inputs)
- Network requests, response payloads, and headers
- Backend traces, logs, and exception data
Step 2: Compare with other browsers
Replicate and record sessions of the same user actions in multiple browsers or on both mobile and desktop to find divergences—such as missing DOM elements, layout shifts, CSS differences, and API errors—and trace exactly when and where they begin. For example, the table below contains a hypothetical side-by-side comparison of how a feature may behave differently in Chrome and Safari:
| Chrome (v118) | Safari (v17) |
|---|---|
| ✔ Button visible | ✘ Button invisible |
| ✔ Layout aligned | ✘ Layout overlaps |
| ✔ Smooth animation | ✘ Stuttering animation |
Step 3: Document discrepancies
Filter recordings by metadata (browser version, viewport size, etc.) and make note of any unexpected behaviors. Tools like Multiplayer allow you to add annotations directly onto session recordings, which can be useful for documenting different kinds of bugs in context and communicating them with team members.
Step 4: Find the root cause
Use data captured within the session recording (network requests, backend traces, console logs, etc.) to identify where things went wrong. For example, in the button example described above, you might find that in Safari, a CSS variable wasn't resolving (so the button never rendered), and a network response lacked a fallback value, causing the UI to omit a component.
Step 5: Verify fixes and prevent regressions
After implementing the necessary code changes, rerun and record the same workflows across different browsers to confirm the findings and capture concrete evidence that the inconsistencies have been resolved. To prevent similar bugs in the future, integrate automated cross-browser tests or visual regression checks into your CI/CD pipeline, and continue to use session recording tools to record and investigate the source of any issues. Over time, this workflow creates a living record of behavior across browsers and devices: Tests reveal what failed, and recordings show exactly how it happened.
Interact with full-stack session recordings to appreciate how they can help with debugging
EXPLORE THE SANDBOX(NO FORMS)
New feature development
The role of session recording in validating new features depends on the type of tool being used. UX-centric session recording tools are primarily used for post-deployment feature analysis. They reveal how customers use the new feature, point out deviations from expectations, and bring edge cases into view early in the release cycle.
For example, consider a "smart filter suggestions" feature that is intended to help users quickly narrow down options in a search or selection interface. The desired flow is as shown in the following diagram.


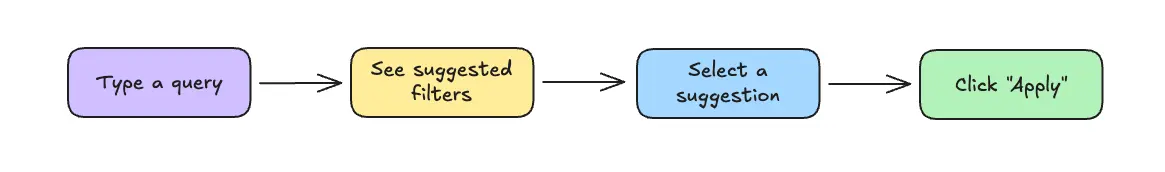
UX-centric workflow
To validate how users are interacting with this feature, teams using UX-centric tools might:
- Deploy the feature to a subset of users.
- Filter session recordings to focus on sessions involving the new feature.
- Identify patterns like skipped steps, unexpected inputs, or repeated actions caused by slowness.
- Inspect frontend and backend data (network requests, console errors, CSS layout issues) to determine root causes.
- Adjust layouts, optimize APIs, or fix UI bugs based on observed user behavior.
The strength of this approach is that it is highly realistic; developers are able to view real user behavior in production and see how features perform in practice. However, because this process occurs after deployment, it often leads to reactive fixes and multiple feedback loops before a feature stabilizes.
Developer-centric workflow
By contrast, developer-centric session recording tools help developers validate features earlier in the development cycle in two ways:
Feature validation in staging
Because these tools include critical information about the whole stack, they capture detailed runtime data for new features within staging environments. Here's how a typical process would look:
- Deploy the new feature to a staging environment that closely resembles production.
- Record simulated user interactions with the new feature and capture network traces, console logs, performance metrics, etc.
- Validate that API requests resolve correctly, UI components render efficiently, and edge cases (e.g., empty search results or latency spikes) are handled gracefully.
- Share findings across engineering and QA to confirm readiness before release.
In the context of the smart filter suggestions feature, correlated frontend and backend session data would help teams answer questions like:
- Did an API latency spike slow suggestion rendering?
- Did a missing debounce cause multiple redundant requests?
- Is a downstream service failing under load?
- Are CSS styles and layout calculations being applied correctly?
You can then use the answers to these questions to adjust layouts, optimize rendering, improve API handling, and generally improve the feature.
Cross-team feature alignment
Developer-centric session recording tools are also built to facilitate team alignment and coordination of new features. In this context, the ability to share sessions and annotate recordings turns them into shared design tools. For example, using a tool like Multiplayer, engineers can:
- Draw directly on replays (e.g., circle a misplaced button or sketch an updated layout)
- Notate individual data points (user clicks, API calls, traces, spans, etc.) in the recording with comments like "API call failure here; see 500 response" or "user abandoned checkout at this step"
- Document requirements, design decisions, or tradeoff considerations
- Share annotated sessions with designers, QA, and backend engineers to ensure that everyone is on the same page
- Feed annotated session replays to AI tools (with correlated full-stack data) to generate code snippets or a proposal for a development plan
In addition to aligning teams around shared context, this workflow helps teams communicate design intent visually and turn session data into actionable development plans.
One click. Full-stack visibility. All the data you need correlated in one session
RECORD A SESSION FOR FREEIntegrating with AI-supported processes
Modern session recording tools are also becoming integral to AI-assisted engineering workflows. Multiplayer, for instance, exposes session data—like user interactions, DOM screenshots, console logs, network packets, backend traces, request/response content, and manually added annotations —via its Model Context Protocol (MCP) server.


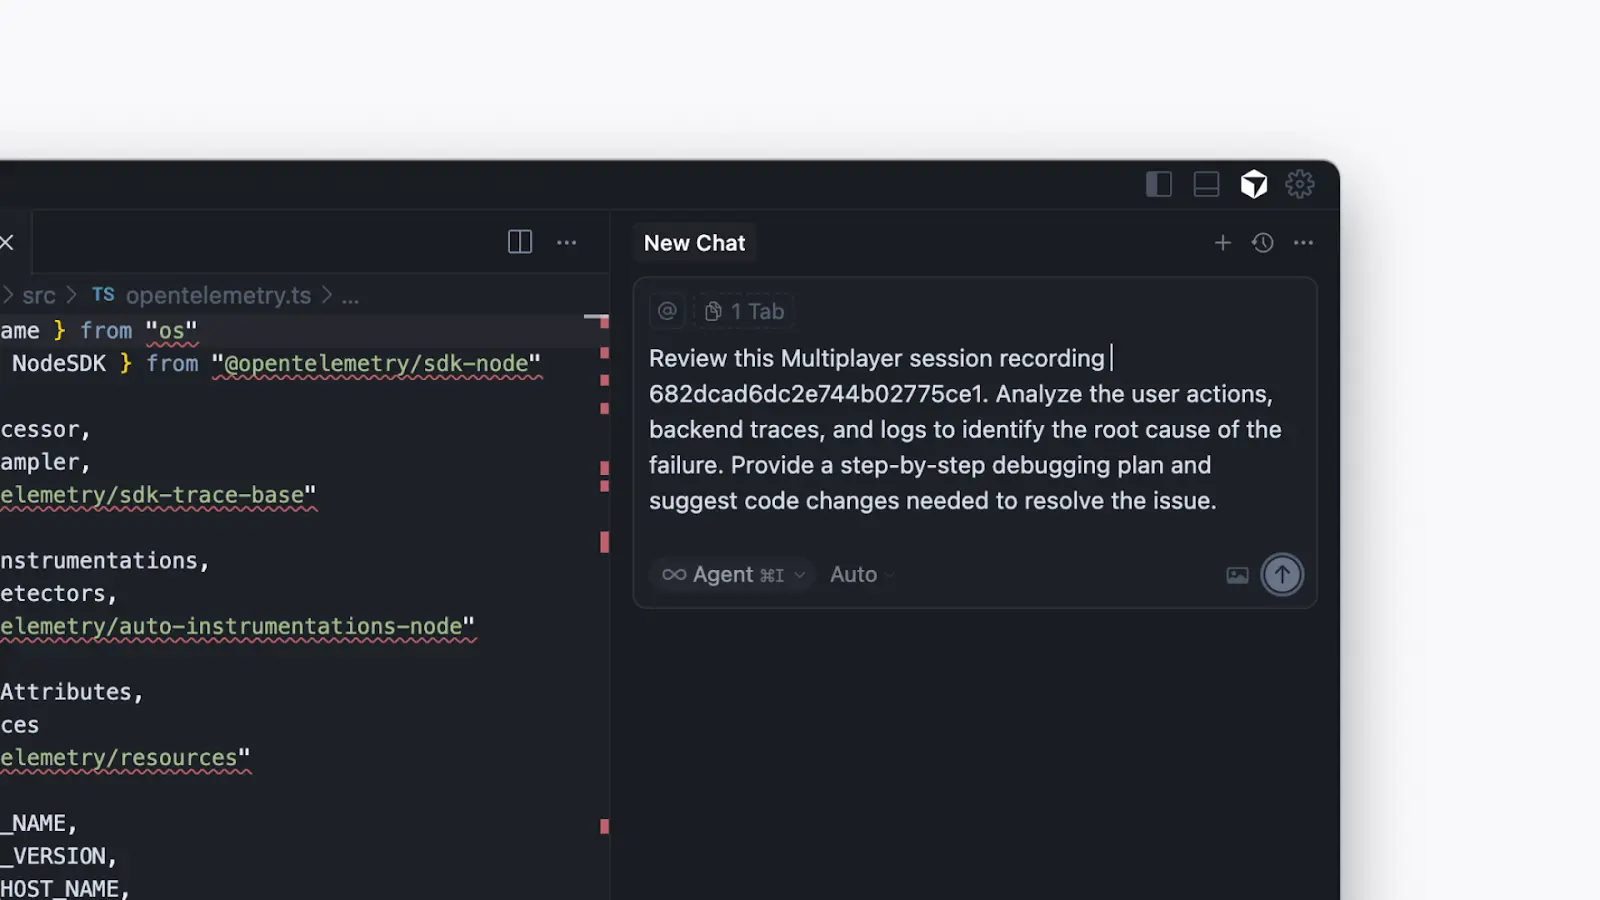
Using Multiplayer's MCP server to debug a distributed system in the Cursor IDE
Instead of guessing from a bug report or static stack trace, AI tools can reason over the actual execution path a user took. They can reconstruct how the UI, API, and data layer behaved in real time, making their outputs far more precise and relevant.
Choosing an effective tool
When evaluating session recording tools, it's important to evaluate what their "AI features" actually do. Some tools provide AI agents that summarize what happened during a replay, but it is critical to know whether these agents have access to both frontend and backend data. Similarly, other tools expose data via an MCP server but only pull frontend events or sampled backend data.
For engineering teams, the most valuable AI capabilities are those that can reason across the full stack with complete context. With this level of visibility, AI can more effectively diagnose root causes, explain performance bottlenecks, and generate actionable suggestions.
In short, "AI" can mean very different things across platforms, and tools with full-stack context are generally most useful for developers debugging and improving complex systems.
Stop coaxing your copilot. Feed it correlated session data that’s enriched and AI-ready.
START FOR FREEConclusion
Session recording provides the greatest value when it's used as an engineering tool that can assist in a variety of scenarios:
- In frontend debugging, it helps developers capture console logs and DOM mutations at the time of failure.
- In backend/API monitoring, it links the actions on the frontend to the logs in the backend through correlation IDs while redacting confidential data.
- In the cross-browser testing scenario, it allows side-by-side comparison across different browsers and devices to expose subtle defects.
- In new feature development, it verifies assumptions and exposes unexpected user interactions.
When treated as an engineering system rather than a playback tool, session recording integrates directly into development and observability workflows. By focusing on how sessions are captured, filtered, and analyzed, engineers can use them as structured contextual data instead of simple replays. This makes session recording a key contributor to faster debugging, more stable feature releases, and better software quality.