Guide
Observability vs Monitoring: Tutorial & Comparison
Table of Contents
With the rise of complex distributed systems based on microservices, APIs, and ephemeral containers, teams are under increasing pressure to detect, diagnose, and resolve issues before they impact user experience or disrupt business operations. While monitoring and observability address these challenges, they differ in a few ways.
Observability has become a buzzword in the software industry in recent years, while monitoring has been part of the industry lexicon for a few decades. Some use the terms interchangeably in casual conversations, while others clearly distinguish between them.
In this article, we examine the differences, overlaps, and use cases for observability and monitoring. We will clarify the meaning of each term, compare their functionalities, and explore how they work together to help teams build, operate, and scale reliable software systems.
Summary of key observability vs monitoring concepts
The table below summarizes five high-level observability vs monitoring concepts this article will explore in detail.
| Concept | Description |
|---|---|
| Comparing observability vs monitoring | Monitoring tracks system health using metrics like CPU usage and error rates. Observability extends this with logs and traces, offering more profound insight into distributed systems by following request flows. |
| When to move toward observability | Monitoring works for single components but struggles with interconnected services. Observability builds on monitoring by adding telemetry data (logs, traces) to reveal system-wide behavior and dependencies. |
| Observability challenges | Key challenges include breaking down data silos, handling massive data volumes, and managing too many tools. Legacy systems within large enterprises often pose greater challenges. |
| Observability use cases | Monitoring and observability provide insights into the health, performance, and interactions of complex systems such as microservices, cloud systems, IoT, and APIs. |
| Observability recommendations and best practices | Best practices include selecting the proper tools, centralizing and standardizing logs with OpenTelemetry, incorporating security monitoring into your observability stack, and automatically mapping service dependencies. |
A brief history of observability and monitoring
To understand the differences between monitoring and observability, it is helpful to examine the history of monitoring and how observability has evolved from it.
Monitoring has been a critical practice since the early days of production systems. It tracks known performance indicators such as CPU usage, error rates, and uptime, helping teams assess system health and detect known issues. It answers questions like “Is the system up?” and “Is the system behaving within expected tolerances?” Many ops teams rely on monitoring to trigger alerts and automate recovery. It’s deterministic, reactive, and reliable. However, it is limited to predefined failure modes.
Traditional observability (sometimes called Observability 1.0) took shape in the 2010s alongside the growth of microservices, containerization, and DevOps culture. It extends system visibility by correlating logs, traces, and metrics within APM dashboards. While it adds diagnostic depth, it remains largely retrospective and often disconnected from developer workflows. As a result, it often produces high telemetry volume, low signal-to-noise ratio, and delayed root cause analysis.
Modern observability (sometimes referred to as Observability 2.0 or o11y 2.0) has emerged over the past several years in response to the need to understand increasingly complex, ephemeral, and distributed systems. It is built on open standards, such as OpenTelemetry, and aims to support distributed tracing at scale, high-cardinality telemetry, and context propagation across service boundaries. Instrumentation is no longer just for Ops; developers, SREs, and QA teams leverage observability throughout the SDLC to ask ad hoc questions, detect emergent behavior, and debug in near real time without relying solely on static dashboards or predefined alerts.
Comparing observability vs monitoring
We’ll deep dive into the differences between modern observability and monitoring shortly. Let’s start with a quick comparison of the two in the table below.
| Monitoring | Observability | |
|---|---|---|
| Goal | Detect known failures | Understand system behavior |
| Data | Metrics, logs | Metrics, logs, traces (correlated) |
| Setup | Predefined rules, alerts | Dynamic, flexible telemetry |
| Impact | Tells you something is broken | Helps you figure out why |
To better understand these concepts, imagine an API suddenly experiencing performance degradation:
- Monitoring tells you that latency has spiked from 50ms to 500ms (a 10x increase).
- Observability reveals that the spike originated in a backend service after a configuration change triggered a downstream timeout.
In other words, monitoring provides foundational visibility into the system’s health by tracking key metrics (in this case, latency) and triggering alerts when thresholds are breached. It works well when the issues are known. Dashboards light up, alerts are triggered, and engineers jump in to resolve the issue.
In contrast, observability enables developers to explore why a system behaves abnormally. It does this by correlating logs, traces, and metrics to provide context across services and infrastructure. When monitoring shows that something is wrong, observability helps pinpoint the root cause.
This shift from symptom detection to root cause understanding is not just theoretical; it fundamentally changes how teams design systems, respond to incidents, and improve performance under pressure.
When to move toward observability
As we have seen, modern observability can provide substantial benefits beyond traditional monitoring. However, it is not always the right choice for every team or project. Many considerations boil down to weighing its long-term advantages against the upfront cost in time, complexity, and team resources.
Observability offers clear advantages: deeper system insight, improved troubleshooting, more effective performance monitoring, increased reliability, and the ability to proactively resolve issues before they escalate. However, adopting observability does introduce some overhead, which varies depending on factors such as system complexity, existing workflows, and team structure. This overhead often involves initial setup, onboarding, and time spent learning new tools and tuning features like filtering, correlation, and visualization to reduce noise and surface meaningful signals in telemetry data.
For applications with relatively simple architectures and small engineering teams, traditional monitoring tools often provide sufficient visibility. Such teams might use a combination of lightweight, cost-effective tools like Prometheus for metrics, the ELK (Elasticsearch, Logstash, Kibana) stack for logs, and Grafana for visualization. These tools introduce minimal operational complexity and are relatively easy to set up.
However, as the system scales, the limitations of basic monitoring become apparent, and observability often shifts from a nice-to-have to a necessity. Common indicators that observability could be worth the lift include:
- A rapidly evolving system with frequent changes
- Increased difficulty diagnosing production issues
- A push to reduce mean time to resolution (MTTR)
- Tedious debugging that slows developers and impacts delivery speed
- Scaling that introduces instability and unpredictable failures
When these challenges emerge, traditional monitoring often can’t keep up. High uptime targets–such as 99.9% availability–leave little time for manual debugging. Without a robust observability strategy, identifying the root cause of failures often involves sifting through scattered logs, attempting to reproduce issues locally, or escalating across teams. These methods are time-consuming and prone to error.
This challenge is particularly pronounced in distributed systems, where services may span Kubernetes clusters, managed cloud services, serverless functions, and data lakes across availability zones. In such environments, the underlying issue may have already disappeared by the time someone accesses the relevant logs. This makes the real-time insight and correlation capabilities of observability tools critical.
Observability’s role in modern systems
As we have seen, observability becomes necessary when systems grow more complex and interdependent. Consider the following scenarios:
- Latency increases, but logs don’t show anything unusual.
- A service crashes, but only in production under specific traffic patterns.
- A payment fails for just one user
- Monitoring flags a 3-second delay on the frontend checkout flow
If any of these issues are intermittent or tied to a specific region, service, user, or dependency, diagnosing them without full system visibility can be extremely difficult. Engineers are addressing issues that are difficult to reproduce or explain.
Observability helps by stitching together logs, metrics, and traces to expose where the system diverges under real-world conditions. For instance, it might show that a particular traffic pattern is triggering a downstream dependency that behaves differently in production than in staging (as in scenario 2). In scenario 4, it could trace a frontend delay back through the stack to uncover:
- An API call hitting a slow endpoint
- That endpoint calling a service in another VPC
- That service executing a SQL query that performs full table scans
In short, observability is not just about faster MTTR. It’s about catching issues sooner, understanding the system more holistically, reducing the frequency of incidents, and preventing them from escalating.
Key observability challenges
Engineering teams often face problems setting up an observability platform. In this section, we explore three common issues and how to remediate them.
Data silos
A prevalent challenge is the fragmentation of telemetry data. Logs, traces, and metrics often live in separate tools, owned by different teams:
| Signal Type | Storage location | Who owns it | Tooling |
|---|---|---|---|
| Logs | Log servers, ELK stack, Kafka | Ops/SRE | Logstash, Fluentd, Splunk |
| Traces | Developer-owned APM tools | Dev Teams | Zipkin, AppDynamics |
| Metrics | Cloud Native Dashboards | CloudInfra/DevOps | Prometheus, CloudWatch |
Without effective correlation, these disparate data sources act as isolated pieces of information, hindering comprehensive analysis. For example, a typical structured log might appear as follows:
{
  "timestamp": "2025-05-07T12:34:56Z",
  "level": "ERROR",
  "logger": "com.example.OrderService",
  "message": "Failed to process order",
  "thread": "http-nio-8080-exec-5",
  "orderId": "12345",
  "exception": "java.lang.NullPointerException: ...stacktrace..."
}
//No built-in correlation with metrics or traces.
//Requires custom fields (orderId, etc.) for any extra context.
Full-stack session recording
Learn more


While this log provides some useful information, it exists in isolation—it’s not inherently connected to traces or metrics. Without shared context, teams must manually stitch together data across tools. This isolation creates several challenges:
- Data is fragmented and lacks shared context
- Signals use different formats, schemas, and correlation models
- Engineers spend more time manually piecing information together
- Root cause analysis becomes slow and speculative
Correlating observability data (logs, traces, and metrics) in one place eliminates this fragmentation and enables all teams to access a consistent and easily understandable narrative of system behavior.
How OpenTelemetry helps
OpenTelemetry makes observability signals consistent, correlated, and portable so that all teams can quickly see the same source of truth. Instead of disconnected data points, OpenTelemetry logs are structured telemetry events with built-in support for trace and span context, consistent semantic conventions, and a unified format for interoperability. For example:
{
  "timestamp": "2025-05-07T12:34:56Z",
  "severity_text": "ERROR",
  "body": "Failed to process order",
  "attributes": {
    "order.id": "12345",
    "exception.type": "java.lang.NullPointerException",
    "exception.message": "...",
    "exception.stacktrace": "...stacktrace...",
    "service.name": "order-service",
    "deployment.environment": "prod",
    "host.name": "host-01"
  },
  "trace_id": "abc123def456...",
  "span_id": "7890ghij...",
  "severity_number": 17
}
Because this log includes trace and span context, it can be automatically linked to related metrics and traces without manual stitching. This solves the following issues:
| Problems caused by data silos | The OpenTelemetry solution |
|---|---|
| Disconnected signals | Unified data model across logs, metrics, and traces |
| Tool-specific formats | Standardized schema (OTLP) |
| Manual Correlation | Built-in trace/span IDs and semantic attributes |
Large data volumes
Modern systems generate terabytes of logs and telemetry data daily. Without structure or filtering, logs become expensive noise, burning storage and compute time.
Imagine your service logs every HTTP request, including static asset requests, health checks, and successful pings:
INFO 2025-05-07T12:00:01Z GET /favicon.ico 200
INFO 2025-05-07T12:00:01Z GET /healths 200
INFO 2025-05-07T12:00:01Z GET /api/orders/456 200
...
Out of millions of these entries, only a small number, such as 5xx errors or anomalous latency spikes, actually matter during incident response. Without structured logging and smart filtering, those critical signals get buried in the noise. To reduce noise and surface what matters, teams need structured logs, built-in context, and the ability to sample or pre-filter based on severity, service, or signal relevance.
OpenTelemetry was designed precisely for these considerations. It reduces noise within high-scale systems where logging and tracing everything isn't feasible, and it tackles the volume problem by providing structured telemetry by default. For example:
{
  "trace_id": "abc123...",
  "span_id": "xyz789...",
  "name": "GET /checkout",
  "attributes": {
    "http.status_code": 500,
    "http.method": "GET",
    "http.target": "/checkout",
    "user.id": "u-456",
    "error": true
  },
  "start_time": "...",
  "duration_ms": 523
}
OpenTelemetry traces, metrics, and logs are all machine-readable and semantically consistent. Because of this, you can easily filter, query, or aggregate telemetry across logs, metrics, and traces by attributes such as http.status_code or error=true, without parsing unstructured log strings.
Interact with full-stack session recordings to appreciate how they can help with debugging
EXPLORE THE SANDBOX(NO FORMS)
Observability in action: Real use cases
The core goal of observability is to provide a deep understanding of a system's internal workings and empower developers to detect, diagnose, and resolve issues quickly and effectively. As such, observability is not about collecting all the data; it is about achieving clear visibility across the entire technology stack and throughout the SDLC. This section examines how engineering teams can apply observability principles to enhance system performance and reliability.
Microservices availability
Modern applications often comprise many microservices, each requiring consistent availability, responsiveness, and adherence to performance budgets. In this context, observability helps developers monitor, understand, and troubleshoot the complex interactions between services.
One common challenge in such architectures involves Java Virtual Machine metrics. A sudden garbage collection spike or heap saturation might go unnoticed until it triggers user-facing issues, such as increased latency, application slowdowns, or service outages. Observability allows you to correlate these low-level metrics with upstream API behavior, enabling you to identify and address potential problems before they impact users.
In addition, if a container exhibits high resource consumption, observability facilitates tracing the issue back to its root cause, such as a memory leak, by connecting disparate data points from metrics, logs, and traces.
Cloud observability
In distributed cloud environments, components often fail in unpredictable ways. By implementing observability, you can consolidate metrics and logs from various cloud services such as AWS Lambda, Amazon S3, and Amazon DynamoDB into a unified view. This aggregated perspective can reveal latency issues that might be difficult to isolate with siloed dashboards.
IoT observability
Observability for IoT devices presents unique challenges due to factors like low-bandwidth connectivity, wide geographical distribution, and intermittent connections.
Despite these constraints, lightweight telemetry that includes data points such as packets per second, firmware versions, and battery levels can effectively signal emerging failures. This allows teams to use observability tooling to detect anomalies, such as a firmware memory leak, before it causes widespread device crashes.
API observability
Modern distributed systems rely heavily on both internal and external APIs, which means that API observability is critical for overall system health. An effective API observability configuration tracks error rates, response latency, and backend dependencies in real time.
For example, an API might exhibit performance degradation during periods of high usage, but these slowdowns may only manifest under specific regional configurations. An observability framework can correlate these performance patterns with underlying infrastructure issues, such as an under-provisioned database shard in a particular availability zone. Once identified, addressing such a targeted issue can yield substantial improvements, such as reduced latency across all services dependent on that API.
Troubleshooting
Whether your system is cloud-based, IoT, or consumes or exposes APIs, debugging a distributed system often means navigating a fragmented picture. Each tool gives you one piece but no end-to-end story. The more services are involved, the more difficult it is to identify the issue.
The first step toward solving this problem is correlating logs across services using shared context, such as trace or span IDs. As we have seen, OpenTelemetry helps by instrumenting systems to emit structured traces, metrics, and logs that carry the same trace context, enabling developers to follow a request’s journey across services.
However, even when structured signals are in place, stitching them into a clear, actionable debugging trail still requires effort. Developers often need to jump between multiple dashboards, search interfaces, and trace visualizations just to understand what went wrong.
Tools like Multiplayer’s full-stack session recordings streamline this process by converting raw observability data emitted by OpenTelemetry into intuitive debugging views. Engineers can create session-based recordings that visualize the full request path, from frontend events (such as clicks and form submissions) to backend services, down to the precise log lines and spans involved. These capabilities dramatically reduce time to resolution and make it easy to share debugging context across teams.


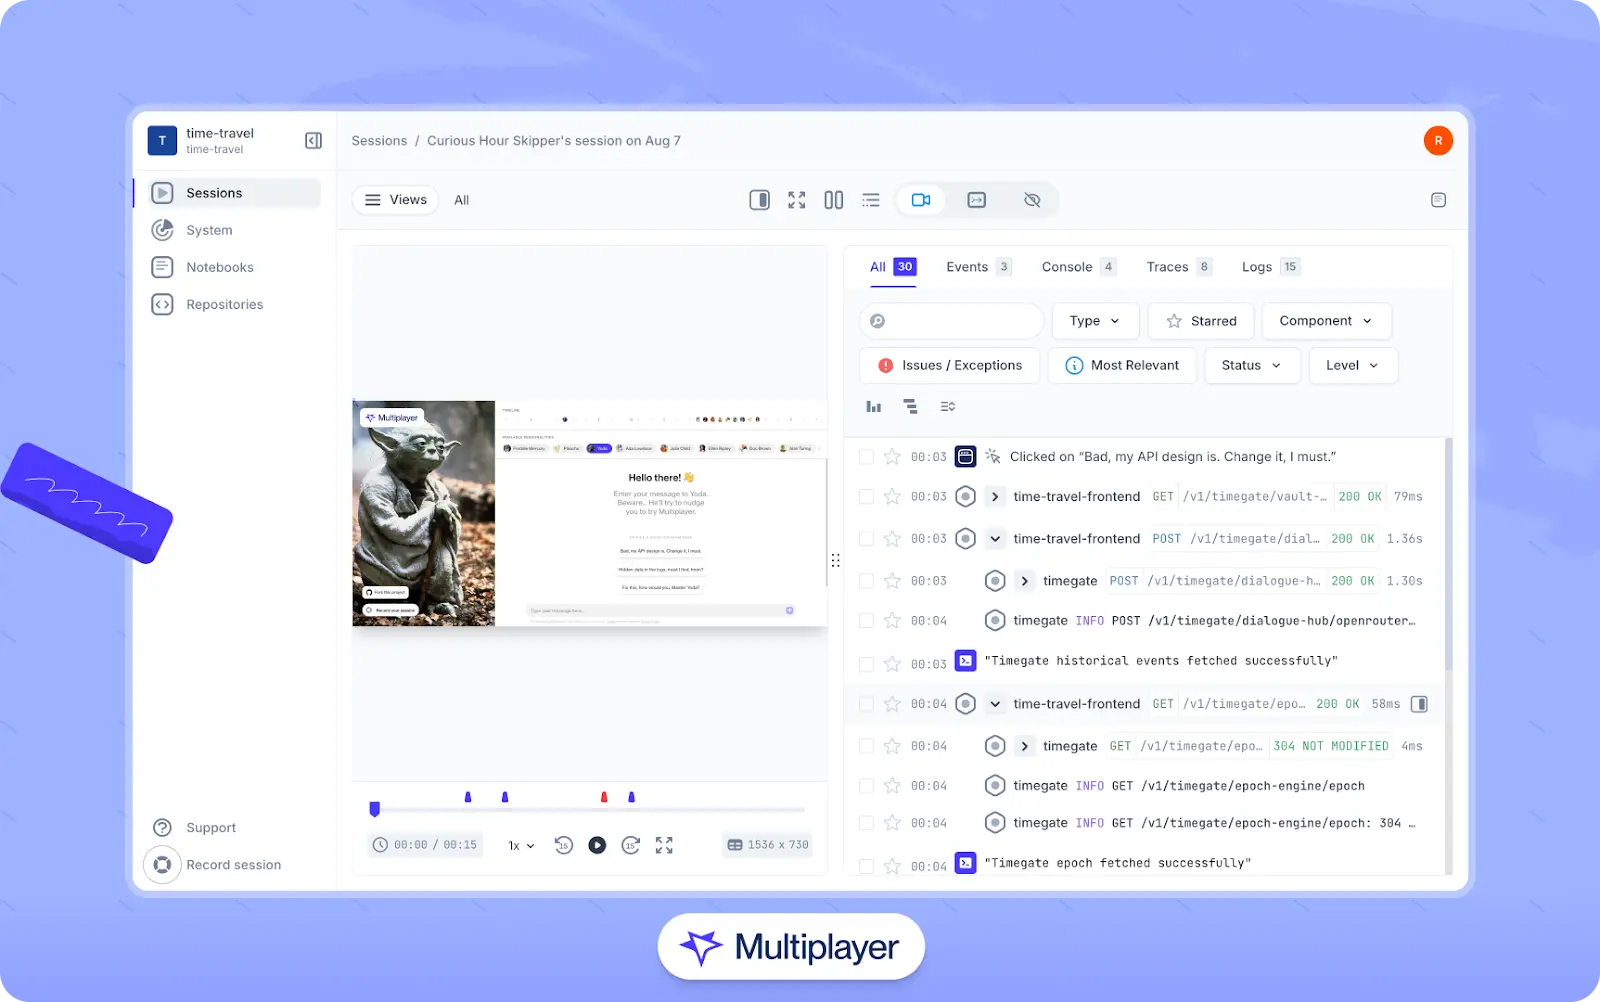
Multiplayer’s full-stack session recordings
Recommendations: How to build an observability stack that works
Building an effective observability stack involves selecting appropriate tools that scale, provide timely responses, and integrate with existing team workflows. While it can be tempting to adopt new technologies, it is better to carefully select a few effective tools that meet the criteria most aligned with your team’s needs. Let’s take a look at how teams can build an observability stack that works in their business context.
Include monitoring
Monitoring should still cover the basics, such as tracking resource usage, request counts, and latency. Choose a tool that suits your application’s underlying environment. For example:
- Prometheus handles time-series metrics well and integrates naturally with Kubernetes.
- Grafana remains a solid choice for creating visualizations across metrics, logs, and more.
- AWS CloudWatch works well for teams that rely heavily on the AWS ecosystem, offering managed metrics, logs, and alarms.
For database-level observability, RDS Performance Insights or Cloud SQL Insights offer query-level visibility. Integrate this data into your broader observability system, preferably using OpenTelemetry to correlate database performance with application logs and traces.
One click. Full-stack visibility. All the data you need correlated in one session
RECORD A SESSION FOR FREEEmbed observability & APM into the system
Observability works best when it is fully integrated into the system. Ideally, observability should be designed into the architecture from the start rather than added later as a separate or disconnected tool. However, there are still ways to embed observability into the architecture, code, and workflows of an existing system.
Add instrumentation directly into your CI/CD pipeline, capture telemetry during deployments, track changes over time, and flag slowdowns as they happen, not after the fact.
To support this, observability tooling like Application Performance Monitoring (APM) should go beyond simple averages by:
- Breaking down response times by endpoint, region, and dependency.
- Capturing outliers, not just means.
- Exposing slow queries, retry storms, or cold starts without manual guesswork.
Centralize logging
Logs scattered across services, stored locally, or written in random formats are not typically helpful during an incident.
Adopt a logging stack like ELK (Elasticsearch, Logstash, Kibana), EFK (Fluentd instead of Logstash), or Loki that consolidates logs across services, standardizes formats, and defines clear retention and access policies. These tools can be paired with OpenTelemetry to store, search, and visualize logs efficiently. Define clear retention and access policies to ensure logs remain available and actionable.
For example, rather than a vague message like:
Payment failed for user 48129A structured log generated via OpenTelemetry might look like:
{
  "timestamp": "2025-04-23T15:32:10Z",
  "level": "ERROR",
  "event": "payment_failed",
  "user_id": 48129,
  "order_id": "ORD-98233",
  "amount": 59.99,
  "currency": "USD",
  "payment_method": "credit_card",
  "error_code": "CARD_DECLINED",
  "service": "payment-service",
  "request_id": "req-xyz987",
  "trace_id": "trace-1234567890abcdef",
  "message": "Card declined by issuing bank"
}
This kind of structured, correlated log gives developers the ability to trace the issue across services and quickly identify patterns or systemic issues.
Build in security from the start
Observability is incomplete without integrated security considerations. Utilize real-time insights to detect both operational failures and security incidents. Monitor for anomalies such as:
- Sudden, unexplained traffic spikes.
- Unexpected outbound network calls.
- Unusual data access patterns.
Employ open-source tools like Trivy or Grype for lightweight vulnerability scanning during build processes. Apply dependency updates consistently, and log authentication events and access control decisions.
Map service dependencies and data flows
Most distributed systems have dynamic architectures. Services are frequently updated, scaled, or redeployed, and new dependencies emerge over time. Without an accurate, up-to-date map of service dependencies and data flows, teams struggle to understand how components interact, which services rely on others, and where failures or performance bottlenecks might propagate.
Manually generating service maps typically involves time-consuming processes like reviewing documentation, analyzing codebases, and tracking network traffic. Besides costing valuable developer time, these methods often fail to keep pace with the rapid changes in modern environments, resulting in outdated or incomplete documentation.
Automated system mapping helps overcome these challenges by continuously capturing and updating the relationships between services, providing a real-time, accurate representation of the system’s architecture. For example, Multiplayer automatically detects service interactions and data flows. It generates up-to-date, interactive diagrams that reflect current dependencies, helping teams quickly understand how components connect, trace the impact of changes or failures across services, and correlate telemetry data with system behavior.

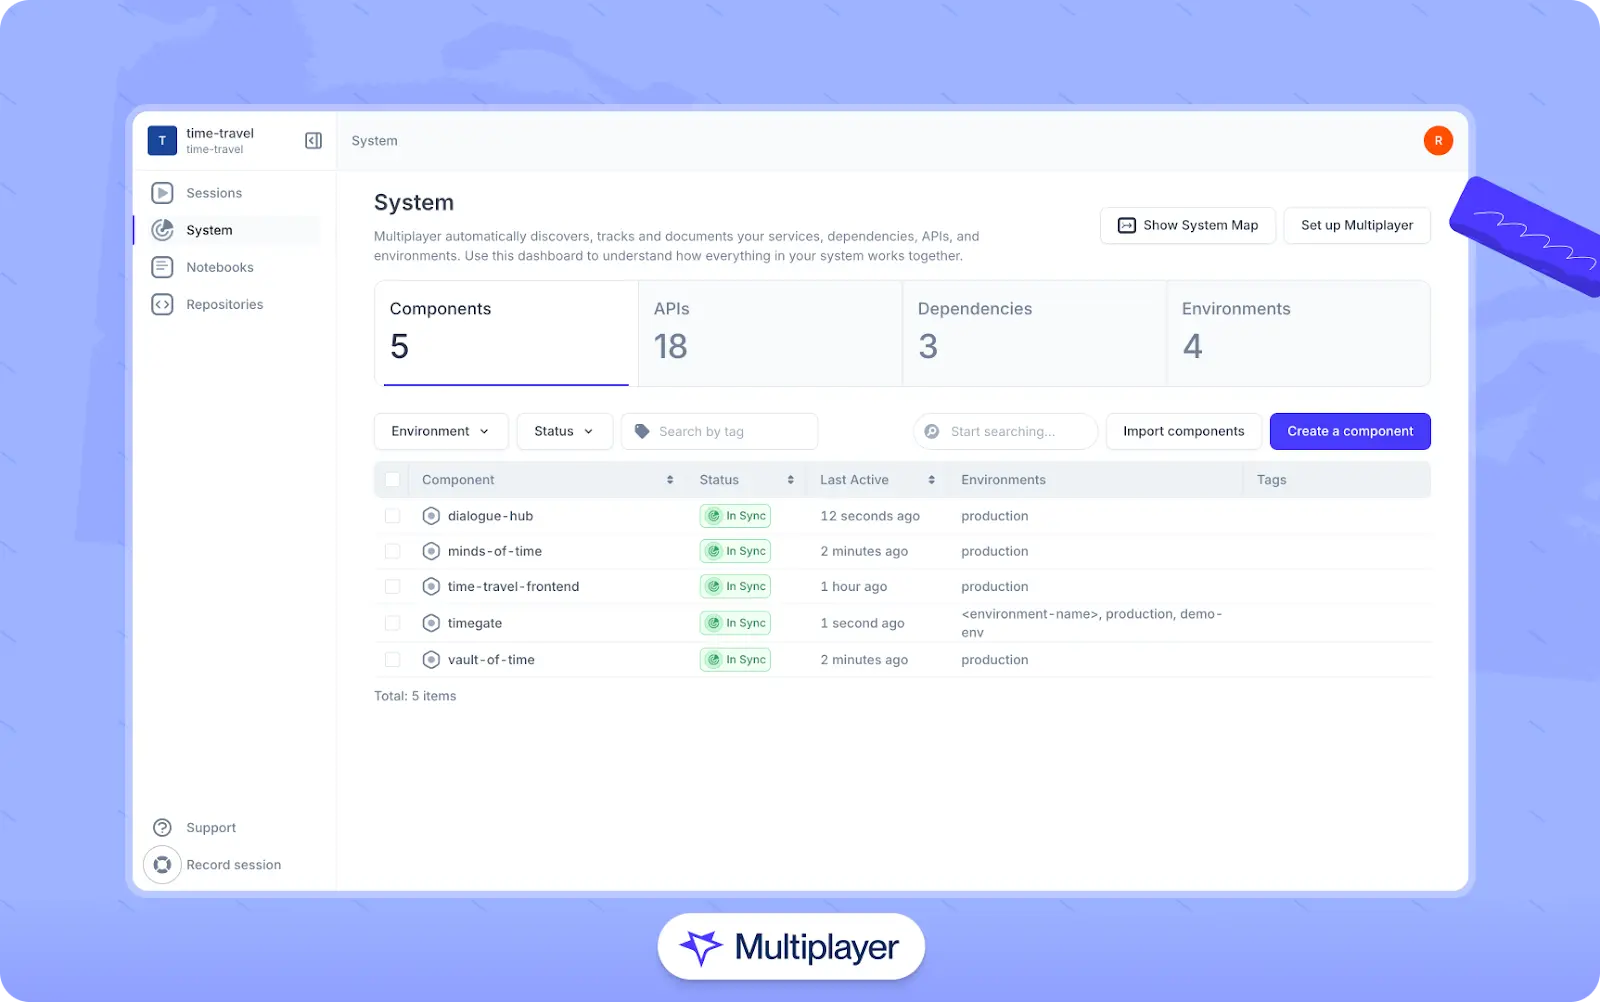
Multiplayer’s System Dashboard
Stop coaxing your copilot. Feed it correlated session data that’s enriched and AI-ready.
START FOR FREELast thoughts
Observability is critical for building reliable, high-performing systems that meet user expectations without the guesswork.
Understanding through observability means more than simply seeing what's happening; it means bringing together metrics, logs, traces, and other telemetry into a cohesive, actionable view. This clarity leads to faster debugging, tighter feedback loops, and better -making across development and operations teams. This results in fewer outages, faster recovery, smarter resource usage, and ultimately, more time spent delivering value than chasing elusive bugs.