Guide
Distributed Tracing: Tutorial & Best Practices
Table of Contents
Imagine finding a request latency issue in your application without knowing if the bottleneck is in your database queries, API calls, or network. Now scale that challenge across dozens of services running in parallel, passing data back and forth. That's what debugging performance issues in distributed systems looks like without proper observability tools.
Distributed tracing is a method of tracking and observing requests as they flow through a set of systems. This observability approach records the trail of a request as it moves across service boundaries, providing visibility into how different components interact during a transaction.
Applications with multiple interconnected services present unique debugging and performance analysis challenges. As you develop more complex microservices, serverless functions, and containerized solutions, traditional monitoring tools focusing on a single monitoring aspect increasingly cannot provide a complete picture of system behavior. Distributed tracing addresses this gap by connecting the dots among services and showing how requests move through your system.
In this guide, we'll cover the core concepts and terminology of distributed tracing, how distributed tracing works, and the benefits and challenges of implementing a tracing system.
Summary of best practices for effective distributed tracing
| Practice | Description |
|---|---|
| Adopt OpenTelemetry for standardized instrumentation | Implement OpenTelemetry across your services, starting with critical components and gradually expanding coverage, to ensure consistency and reduce maintenance overhead. |
| Implement proper context propagation | Ensure the trace context is correctly passed across services to maintain complete request flow across system boundaries and preserve the parent-child relationship between spans. |
| Balance sampling and performance | Develop sampling strategies that capture important traces while filtering routine ones to manage data volume without sacrificing visibility. |
| Correlate traces with logs and metrics | Link trace IDs with logs and metrics to create a unified observability approach that simplifies troubleshooting and provides system insights. |
| Visualize and analyze service dependencies | Use trace data to generate service maps that show system interactions and potential bottlenecks. |
| Capture end-to-end sessions | Record complete user interactions, from frontend to backend, to provide full context during debugging. |
| Establish collaborative debugging workflows | Create processes for teams to share trace data effectively, reducing MTTR and enabling faster cross-team issue resolution. |
Understanding distributed tracing
Applications designed for scalability and composed of loosely coupled components often run across multiple hosts, containers, and cloud providers. This distributed architecture complicates request tracking because when failures occur, the root cause might be in any of the dozens of services, systems, or networks.
Distributed tracing solves this problem by tracking requests across service boundaries, creating a connected view of the transaction path. Let's examine the technical building blocks that make this possible.
Traces, spans, and context propagation
A trace represents the complete execution path of a single request as it moves through multiple services. Each trace is composed of a tree of operations called spans.
A span captures a discrete unit of work within the trace, such as an HTTP request, gRPC call, database query, or message queue operation.
For example, each span can contain timing data and metadata:
{
  "name": "GET /api/users/123",
  "traceId": "abc123",
  "spanId": "span456",
  "parentSpanId": "span789",
  "startTime": "2025-05-10T15:01:23.045Z",
  "endTime": "2025-05-10T15:01:23.098Z",
  "attributes": {
    "http.method": "GET",
    "http.url": "/api/users/123",
    "http.status_code": 200,
    "service.name": "user-service"
  },
  "events": [
    {
      "name": "cache_miss",
      "timestamp": "2025-05-10T15:01:23.067Z"
    }
  ]
}
Context propagation maintains trace continuity across service boundaries. When Service A calls Service B, the trace context must be transmitted with the request. This typically happens via:
- HTTP headers (e.g.,
X-B3-TraceId,traceparent) - gRPC metadata
- Message queue headers
- Custom application protocol headers
Without proper context propagation, you end up with disconnected trace fragments rather than a coherent end-to-end view.
Parent-child span relationships
Spans form a hierarchical relationship that mirrors the execution flow:
- The root span initiates the trace, often representing the initial user request.
- Child spans represent work triggered by parent spans.
- Each span (except the root) references its parent span.
- This creates a directed acyclic graph (DAG) of operations.
This hierarchy shows both causality and the nested timing relationships between operations.
Trace IDs and span IDs
These are the technical identifiers in distributed tracing:
- Trace ID: A globally unique identifier (typically a 128-bit value) that remains constant throughout the request lifecycle. All spans belonging to the same trace share this ID.
- Span ID: A unique identifier for each span within a trace.
- Parent Span ID: A reference to the span that caused the current span to occur.
These identifiers enable trace reconstruction and analysis across distributed logs and metrics.
How distributed tracing differs from traditional monitoring
Traditional monitoring falls short in distributed environments because it was designed for monolithic architectures. This monitoring uses two primary elements:
- Metrics are time-series data like CPU usage, request rates, and error counts that provide aggregated views of system health but lack per-request granularity. Metrics answer “what” is happening, but not “why” or “where.”
- Logs contain detailed event information but are isolated within each service. When a request spans multiple services, correlating logs becomes nearly impossible without standard identifiers.
Distributed tracing adds important context by connecting operations across system boundaries. When you see a slowdown, traces show whether it's happening in a database query, a network hop, or a downstream service, pinpointing problems that metrics only hint at.
The relationship among tracing, logging, and metrics
Practical observability requires integrating three pillars:
- Traces revealing request paths and timing relationships
- Logs capturing detailed execution events and error messages
- Metrics showing aggregated performance trends and health indicators
When combined, you get both the big picture and the fine details. For example, when metrics show a spike in latency, traces show which requests are slow, and logs explain why those requests failed. Consider the following log message:
{
"timestamp": "2025-05-10T15:01:23.067Z",
"level": "INFO",
"service": "user-service",
"traceId": "abc123",
"spanId": "span456",
"message": "User request processed successfully",
"user_id": "123"
}
This log entry demonstrates proper trace context integration:
traceId=abc123links this log to a specific distributed transaction.spanId=span456connects it to a particular operation within that trace.- The timestamp allows temporal correlation with metrics.
- The service name
[user-service]identifies the component. - The business context (
user_id=123) and performance data (processing_time=53ms) provide operation-specific details.
When investigating issues, this correlation structure is critical. For example, suppose a trace shows a slowdown in the payment service. In that case, you can filter logs across all services using the trace ID to see what happened during that specific transaction, from authentication through order processing to payment confirmation.
How distributed tracing works
Tracing systems need multiple components working together to track requests across services. Let's break down distributed tracing mechanics and architecture.
The mechanics behind tracing
At its core, distributed tracing operates on a straightforward principle: Assign unique identifiers to requests and track them across services. As simple as it may seem, though, the execution involves several layers:
- Instrumentation: Code that captures trace data at key points in your application
- Context propagation: Mechanisms to pass trace identifiers between services
- Data processing: Components that collect, store, and index trace data
- Visualization: Tools to search and display trace data in a useful format
A typical trace flow works like this:
- When a request first enters your infrastructure, instrumentation creates a root span and generates a unique trace ID.
- As the request triggers calls to other services, child spans are created and linked to the parent span.
- The trace context (trace ID and parent span ID) is passed to each downstream service.
- Each service adds its own spans to the trace, recording operations and their timing.
- Completed spans are reported to a central collection service.
- The collection service reconstructs the complete trace from individual spans.
Key components in a distributed tracing system
A complete tracing system consists of multiple specialized components working together to collect, process, and analyze trace data across your distributed architecture. The elements of such a system are described in the table that follows.
| Element | Description | Details |
|---|---|---|
| Instrumentation libraries | Language-specific implementations for creating spans | Examples: OpenTelemetry SDKs, client libraries |
| Collectors/agents | Services that receive, process, and forward span data |
|
| Storage backend | Database optimized for trace data |
|
| Query and visualization frontend | UI for searching and analyzing traces |
|
| Context propagation formats | Standardized formats for passing trace context |
|
Implementing distributed tracing
Once you learn how distributed tracing works, the next step is implementing it in your environment. This section will cover the practical aspects of adding tracing to your applications, managing trace data volume, and using industry standards.
Instrumentation options
Instrumentation is adding code to your applications to generate trace data. The approach you choose impacts development effort, flexibility, and maintenance requirements.
Manual instrumentation gives you complete control by adding tracing code directly to your application. You explicitly create spans, add business context as attributes, and handle error conditions. This provides maximum flexibility but requires significant development effort and consistent team practices.
// Example of manual instrumentation in Java with OpenTelemetry
Span span = tracer.spanBuilder("processOrder").startSpan();
try (Scope scope = span.makeCurrent()) {
    // Business logic
    span.setAttribute("order.id", orderId);
    span.setAttribute("order.value", orderValue);
    // More processing
} catch (Exception e) {
    span.recordException(e);
    span.setStatus(StatusCode.ERROR);
    throw e;
} finally {
    span.end();
}

@Trace
public Order processOrder(String orderId, double orderValue) {
    // Business logic only - tracing handled by annotation
    return orderService.createOrder(orderId, orderValue);
}
The code above creates a new span named processOrder, makes it the active span, adds business context (order ID and value) as attributes, records any exceptions that occur, and properly closes the span when the operation completes. This pattern ensures accurate timing and proper error tracking.
Full-stack session recording
Learn more


Automatic instrumentation uses agents or framework plugins that add tracing without code changes. These agents modify bytecode or leverage language hooks to instrument common libraries and frameworks automatically. While this dramatically reduces implementation effort, it may not capture all the business context needed for effective troubleshooting.
# Running a Java application with the OpenTelemetry auto-instrumentation agent
java -javaagent:opentelemetry-javaagent.jar \
     -Dotel.service.name=order-service \
     -Dotel.traces.exporter=otlp \
     -Dotel.exporter.otlp.endpoint=http://collector:4317 \
     -jar order-service.jar
To correlate traces with logs, you'll also need to configure your logging framework to include trace information. Here’s an example using Log4j2:
<?xml version="1.0" encoding="UTF-8"?>
<Configuration>
  <Appenders>
    <Console name="Console" target="SYSTEM_OUT">
      <PatternLayout
        pattern="%d{HH:mm:ss.SSS} [%t] %-5level %logger{36} traceId=%X{traceId} spanId=%X{spanId} traceFlags=%X{traceFlags} - %msg%n"/>
    </Console>
  </Appenders>
  <Loggers>
    <Root>
      <AppenderRef ref="Console" level="All"/>
    </Root>
  </Loggers>
</Configuration>
This configuration automatically injects trace IDs, span IDs, and trace flags into your log messages when using OpenTelemetry auto-instrumentation, enabling you to correlate logs with specific traces.
Library instrumentation uses preinstrumented versions of common components like database drivers, HTTP clients, and web frameworks. These libraries automatically create spans for operations while still allowing you to add custom spans for business logic. This balances convenience with flexibility but requires updating dependencies.
Most production deployments combine these approaches—automatic instrumentation provides baseline coverage, while strategic manual instrumentation adds critical business context. This hybrid approach minimizes development overhead while ensuring that traces contain the information needed for effective analysis.
Trace sampling strategies
High-volume applications generate too many traces to collect and store them all feasibly. A busy service handling thousands of requests per second would quickly overwhelm any tracing backend if every request were fully traced.
There are a number of strategies that can be employed for sampling.
Head-based sampling
In this approach, a sampling decision is made when a trace begins. The sampling decision is made once and propagated with the trace context through all services.
Head-based sampling is simple and low-overhead, but it may miss important traces (like errors that occur later in the request lifecycle). It also cannot make decisions based on the content of the trace, such as whether an error occurred or if latency was high.
Example: Sample 10% of all incoming requests


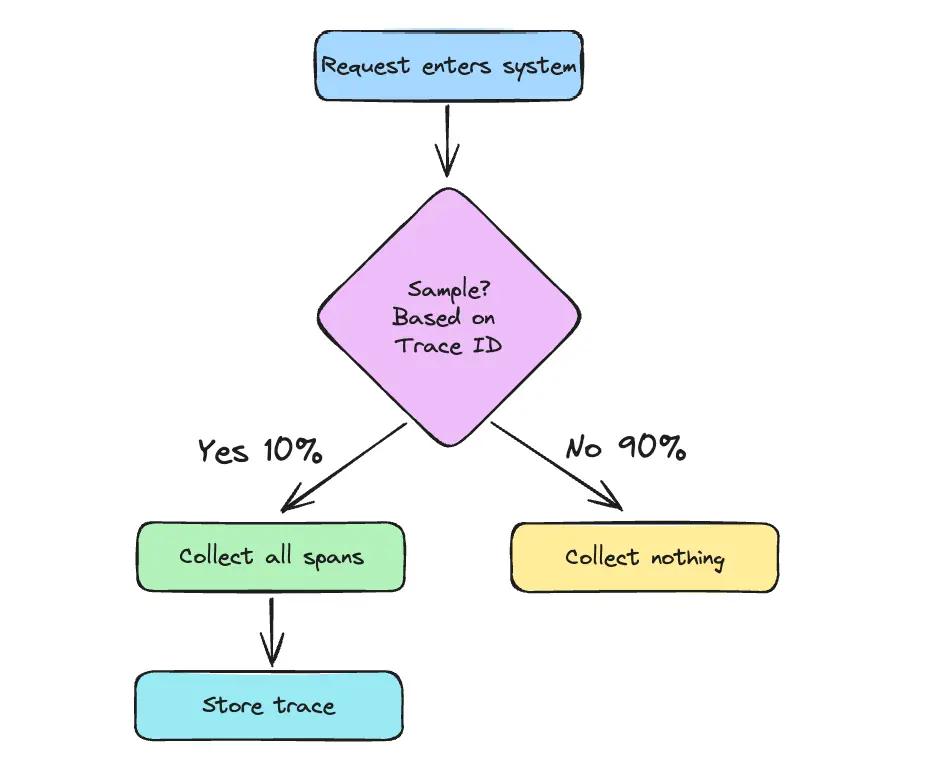
Head-based sampling
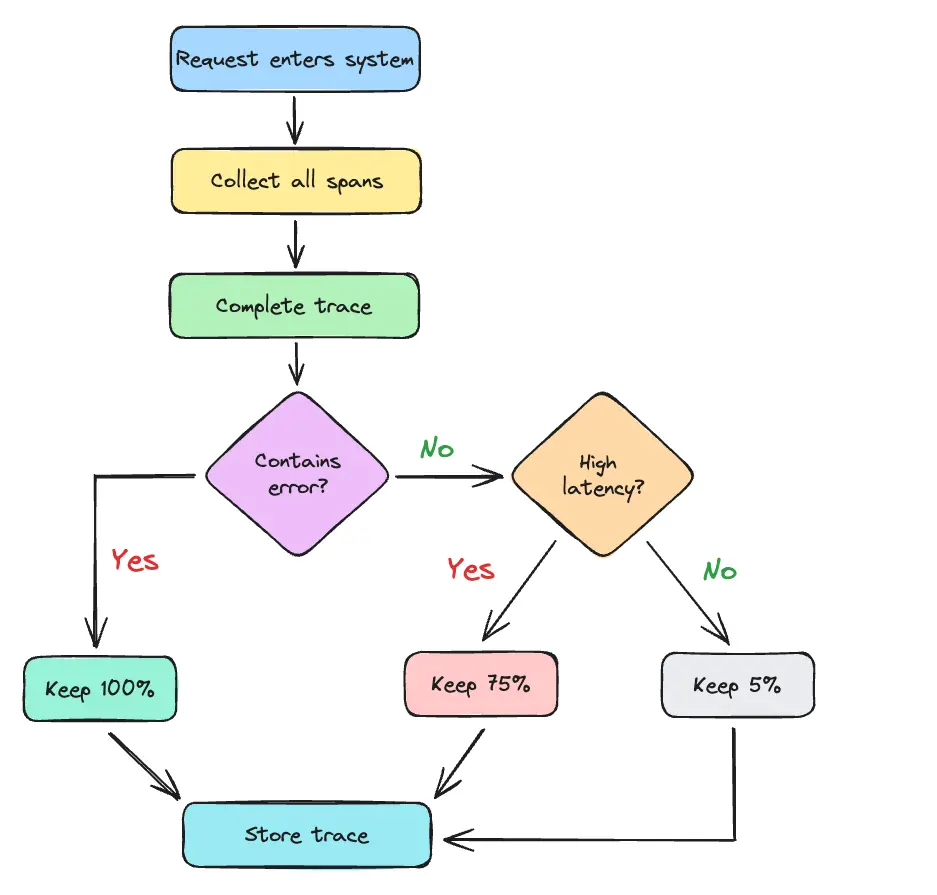
Tail-based sampling
This method involves collecting data for all traces and making sampling decisions after completion. It includes sampling based on specific attribute values (like customer ID or transaction type).
It preserves important traces (e.g., errors or slow requests) but has higher resource requirements for buffering.
Example: Keep 100% of error traces, 75% of slow traces, and 5% of typical traces.


Tail-based sampling
Rate-limiting sampling
This approach adjusts sampling rates dynamically based on traffic volume. It provides a stable trace volume regardless of traffic spikes.
Example: Sample at most 100 traces per minute.
Adaptive sampling
This method changes sampling rates based on observed behavior. For example, it can increase sampling when errors spike and reduce it for repetitive, healthy traces.
Example: Increase sampling rate for a service when its error rate exceeds 1%.
Interact with full-stack session recordings to appreciate how they can help with debugging
EXPLORE THE SANDBOX(NO FORMS)
OpenTelemetry overview and benefits
OpenTelemetry has become the industry standard for instrumentation, offering a vendor-neutral approach to collecting observability data across all major programming languages and frameworks. The OpenTelemetry project brings several key advantages to tracing implementations.
First, it provides vendor-neutral instrumentation that works with virtually any backend system. This prevents vendor lock-in and allows you to change visualization tools without reinstrumenting your code. You instrument once but can export the data anywhere, preserving your investment as your observability strategy matures.
OpenTelemetry offers consistent APIs across languages, with implementations for Java, Go, Python, JavaScript, .NET, Ruby, PHP, Erlang, and others. This consistency makes it ideal for microservices architectures with services written in different languages because teams can follow the same patterns regardless of their technology stacks.
# Python OpenTelemetry example showing the separation of concerns
from opentelemetry import trace
from opentelemetry.sdk.trace import TracerProvider
from opentelemetry.sdk.trace.export import BatchSpanProcessor
from opentelemetry.exporter.otlp.proto.grpc.trace_exporter import OTLPSpanExporter

# SDK configuration (deployment-time concern)
provider = TracerProvider()
processor = BatchSpanProcessor(OTLPSpanExporter(endpoint="collector:4317"))
provider.add_span_processor(processor)
trace.set_tracer_provider(provider)

# API usage (development-time concern)
tracer = trace.get_tracer(__name__)
with tracer.start_as_current_span("my_operation") as span:
    span.set_attribute("attribute_key", "attribute_value")
    # Business logic here
The Python code above demonstrates OpenTelemetry's separation of concerns.
The first section configures the SDK by setting up a TracerProvider, a BatchSpanProcessor for efficient export, and an OTLPSpanExporter that sends data to a collector. This configuration happens at deployment time and can be changed without modifying application code.
The second section shows the API usage in application code: creating a span, setting attributes, and executing business logic. This clear separation allows libraries to use the API without assuming anything about the backend configuration.
Benefits and challenges of implementing distributed tracing
While presenting certain implementation difficulties, distributed tracing significantly benefits your debugging workflows. Knowing both sides allows you to optimize the return on your observability investment.
Performance insights and optimization
By capturing timing data for each operation, traces indicate exactly where a bottleneck occurs in a transaction. This visibility allows you to pinpoint specific components causing slowdowns rather than making educated guesses.
Trace visualization typically uses waterfall or flame graph formats showing the hierarchical relationship between spans, sequential timing of operations, and latency hotspots.
For example, a trace for an ecommerce purchase might show the following:
- Frontend API gateway receiving the checkout request (10 ms)
- Authentication service validating the user (25 ms)
- Inventory service checking stock (40 ms)
- Database query to inventory table (35 ms)
- Payment service processing the transaction (350 ms)
- External call to payment provider (330 ms)
- Order service creating the order (30 ms)
- Database write to orders table (25 ms)
- Notification service sending confirmation (45 ms)
- Message broker publish (5 ms)
- Email service sending message (40 ms)
System understanding and visibility
Many teams do not have precise records of how their services interact. Distributed tracing can map these relationships based on actual traffic, building a real-time system diagram that shows the present architecture instead of out-of-date documentation. This visibility provides insights for architectural decisions—before modifying or replacing a service, you can see which other components depend on it and how they interact.
Trace data also shows unused code paths, redundant calls, and optimization opportunities that might go unnoticed. For example, traces might show a service making three separate database queries that you could combine into one, or it may indicate that a caching layer isn't working as intended.
Team collaboration and operational efficiency
Distributed tracing creates a common observability language across development, operations, and platform teams. When discussing system behavior or looking into problems, all team members can refer to the same trace data, thereby avoiding inconsistencies and blame transfer.
Traces provide on-call engineers the context they need to diagnose unfamiliar services. Instead of starting from scratch, they can follow the transaction path through the system, significantly cutting incident response time.
Implementation and operational challenges
Despite its benefits, putting distributed tracing into practice presents certain challenges. Instrumentation requires careful balance: Too little provides insufficient visibility, while too much creates performance overhead. Many teams begin with automatic instrumentation and progressively add custom instrumentation for key business operations.
Context propagation across heterogeneous services represents another challenge, mainly when some components use different technologies or come from third-party vendors. Standardizing on protocols like W3C Trace Context helps, but integration gaps often remain.
In high-traffic systems, data volume can quickly become a concern. A moderately busy service might generate thousands of spans per minute, creating storage and cost challenges. This requires creating sampling strategies that preserve valuable traces while managing data volume.
Legacy systems often lack current instrumentation capabilities, creating blind spots in trace data. Teams must decide whether to modify these systems, create proxy instrumentation, or accept partial trace coverage.
Best practices for effective distributed tracing
This section covers essential best practices that will help you maximize the value of your tracing solution and reduce potential challenges.
Adopt OpenTelemetry for standardized instrumentation
OpenTelemetry is ideal for distributed tracing, offering a consistent instrumentation approach across platforms and languages. Instrument your most essential services first, then progressively extend coverage to less critical components.
When implementing OpenTelemetry, use consistent naming conventions for services and operations. Follow the semantic conventions defined by the OpenTelemetry specification to ensure compatibility with analysis tools.
For example, HTTP spans should use standard attribute names like http.method, http.url, and http.status_code.
A common challenge with OpenTelemetry adoption is managing the configuration across multiple services. Tools like Multiplayer's OpenTelemetry integration simplify this process by offering ready-to-use settings for several languages and frameworks, allowing you to focus on which services to use instead of the technical implementation aspects.
Implement proper context propagation
Context propagation ensures trace continuity across service boundaries. Without it, you end up with disconnected trace fragments rather than end-to-end visibility. Standardize on W3C Trace Context for HTTP communications and equivalent mechanisms for other protocols.
For HTTP services, ensure that headers like traceparent and tracestate are properly passed between services:
traceparent: 00-4bf92f3577b34da6a3ce929d0e0e4736-00f067aa0ba902b7-01
tracestate: rojo=00-4bf92f3577b34da6a3ce929d0e0e4736-00f067aa0ba902b7-01,congo=lZWRzIHRoNhcm5hbCBwbGVhc3VyZS4
Pay special attention to asynchronous operations where context can easily be lost. For message queues, include trace context in message headers. For background jobs, store the trace context when scheduling and restore it during execution.
Cross-origin requests present a particular challenge for web applications. You'll need to configure your services to properly handle trace propagation, as shown in this code example:
# Example using Flask with OpenTelemetry to enable CORS for trace propagation
from flask import Flask, request, jsonify
from flask_cors import CORS

app = Flask(__name__)
CORS(app, resources={r"/api/*": {"origins": ["https://frontend.example.com"]}},
     expose_headers=["traceparent", "tracestate"])

@app.route('/api/payment', methods=['POST'])
def payment():
    # Your payment processing logic here
    return jsonify({"status": "success"}), 200

if __name__ == '__main__':
    app.run()
This Flask configuration explicitly allows trace context headers sent across domains to ensure trace continuity between frontend and backend services.
One click. Full-stack visibility. All the data you need correlated in one session
RECORD A SESSION FOR FREEBalance sampling and performance
As your application scales, you must balance comprehensive tracing against performance and cost considerations. Implementing sampling strategies will help you manage data volume while preserving visibility into critical paths.
Start with higher sampling rates (e.g., 25-50%) during initial implementation to establish baseline patterns. As you gain understanding of your system's behavior, adjust sampling based on traffic volumes and business importance. The following code snippet configures a sampling strategy that traces 15% of root requests but always keeps traces containing errors, thereby balancing visibility with performance.
# Example OpenTelemetry sampler configuration in Python
from opentelemetry.sdk.trace.sampling import TraceIdRatioBased, ParentBased

# Sample 15% of traces for documentation
doc_sampler = TraceIdRatioBased(0.15)

# Python config for OpenTelemetry with sampling
tracer_provider = TracerProvider(
    sampler=ParentBased(
        root=doc_sampler,
        # Always sample if parent is sampled
        remote_parent_sampled=TraceIdRatioBased(1.0),
        # Always sample errors regardless of parent
        remote_parent_not_sampled=TraceIdRatioBased(0.0)
    ),
    resource=resource
)
Consider implementing different sampling strategies for different services. High-volume, less critical services might use lower sampling rates (1-5%), while business-critical transaction paths maintain higher fidelity (50-100% for error paths).
Tools that support flexible, contextual sampling strategies help navigate this trade-off by allowing you to focus resources on the most critical transactions.
Correlate traces with logs and metrics
A complete observability strategy integrates traces with logs and metrics. This correlation provides context for performance anomalies and helps troubleshoot complex issues across service boundaries.
Inject trace IDs into log messages to connect distributed traces and relevant logs. Use consistent attribute naming across traces, logs, and metrics to simplify correlation.
For example, use the same service names, operation names, and customer identifiers in all three signals. This code injects trace and span IDs into log messages, allowing you to find all logs related to a specific transaction across multiple services.
# Example of log correlation in Python
import logging
from opentelemetry import trace

current_span = trace.get_current_span()
logger = logging.getLogger(__name__)

logger.info("Processing payment", extra={
    "trace_id": current_span.get_span_context().trace_id,
    "span_id": current_span.get_span_context().span_id,
    "payment_id": payment.id,
    "amount": payment.amount
})
Visualize and analyze service dependencies
Service dependency visualization transforms abstract trace data into actionable insights about your system architecture. These visualizations help identify bottlenecks, unnecessary dependencies, and potential points of failure.
Generate dependency graphs from trace data to understand how services interact across the environments. Such graphs often reveal unexpected dependencies and communication patterns that aren't documented elsewhere. In addition, regularly comparing real-world dependency maps to your expected architecture helps identify drift, uncover optimization opportunities, and maintain architectural governance as your system evolves.


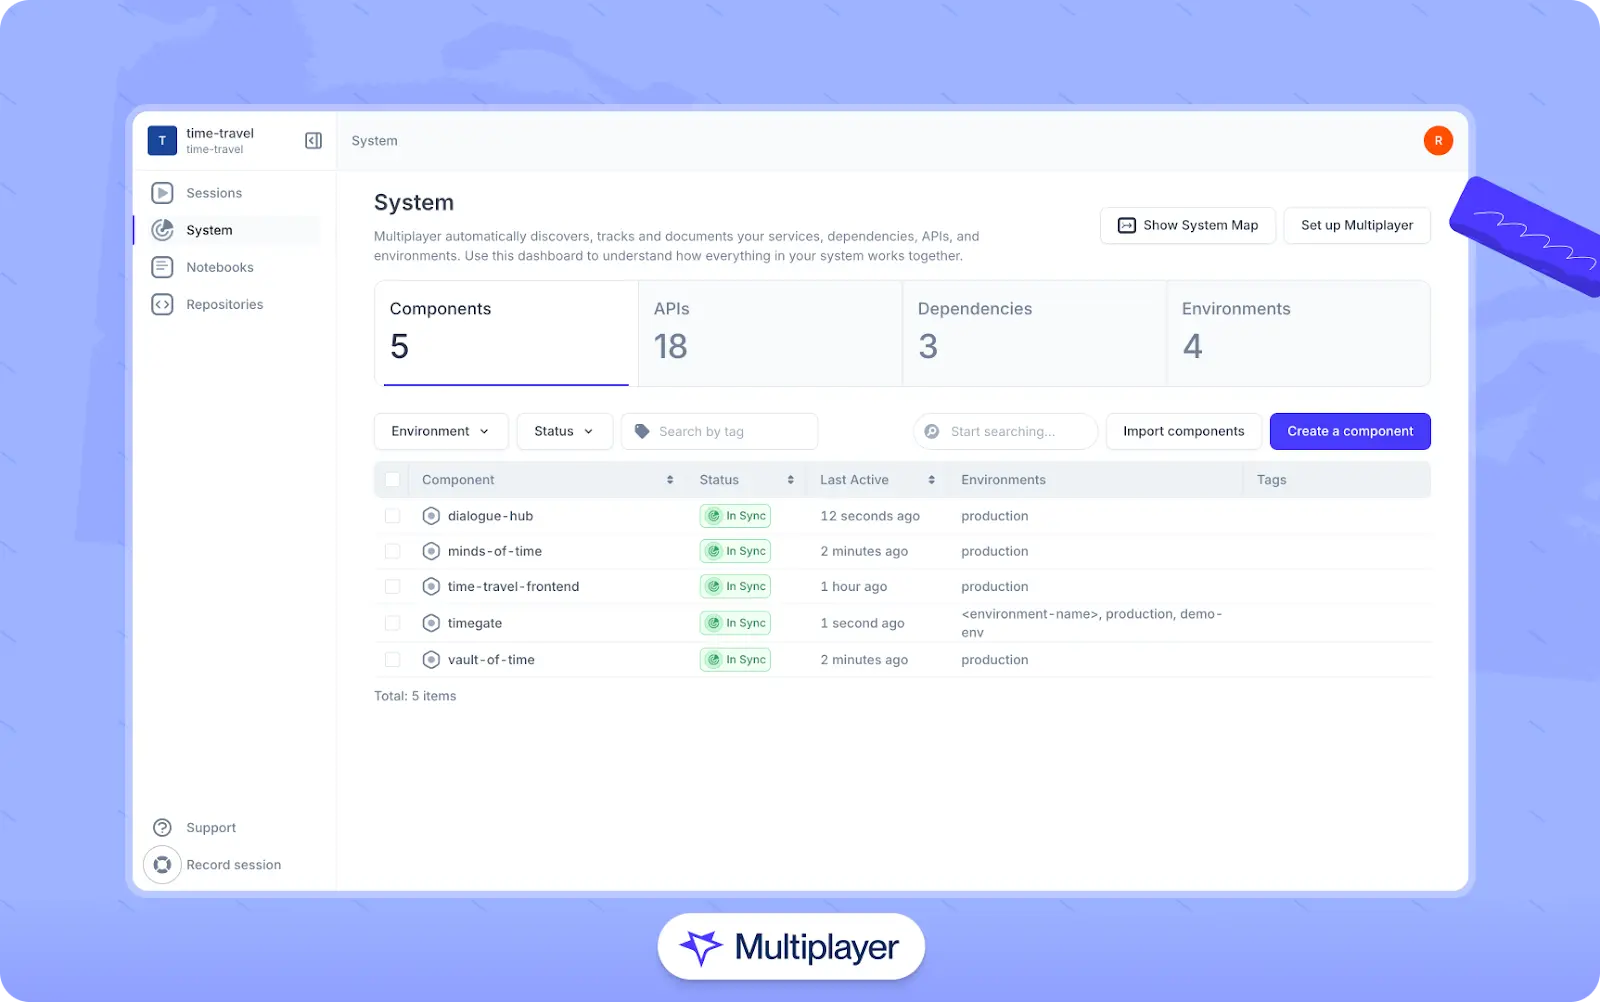
Multiplayer’s real-time visualization of service dependencies
Tools like Multiplayer's system dashboard assist in this process by automatically discovering components and their interactions through trace data. The system dashboard also provides real-time visualization of these service relationships alongside telemetry data. This keeps your documentation in sync with what's happening in the environment.
Capture end-to-end user sessions
Complete visibility requires tracing from the user's first interaction through all backend processing. An end-to-end perspective connects user experience to backend performance, providing crucial context for troubleshooting.
Implement frontend instrumentation that captures user interactions and connects them to backend traces. While frontend code typically runs in JavaScript, you can configure your Python backend to receive and process the trace context properly.
For example, include user context in traces to connect technical issues with user impact. Attributes like user ID, session ID, or business transaction type help prioritize issues based on customer impact.
For instance, the FastAPI middleware below extracts trace context from incoming requests, ensuring that frontend-initiated traces properly connect with backend operations.
# Example FastAPI backend configured to receive frontend trace context
from fastapi import FastAPI, Request
from opentelemetry.propagate import extract
from opentelemetry import trace

app = FastAPI()

@app.middleware("http")
async def extract_trace_context(request: Request, call_next):
    # Extract the trace context from the incoming request headers
    context = extract(request.headers)
    token = trace.set_span_in_context(
        trace.get_current_span(), context=context
    )

    # Create a new context with the extracted span context
    with trace.use_span_context(token):
        response = await call_next(request)
        return response
The challenge with end-to-end tracing is maintaining context across the frontend-backend boundary, especially when multiple services are involved. Multiplayer's full stack session recordings solve this problem by capturing the entire user journey from GUI interactions to backend processing, offering an integrated view to get the whole context of issues.

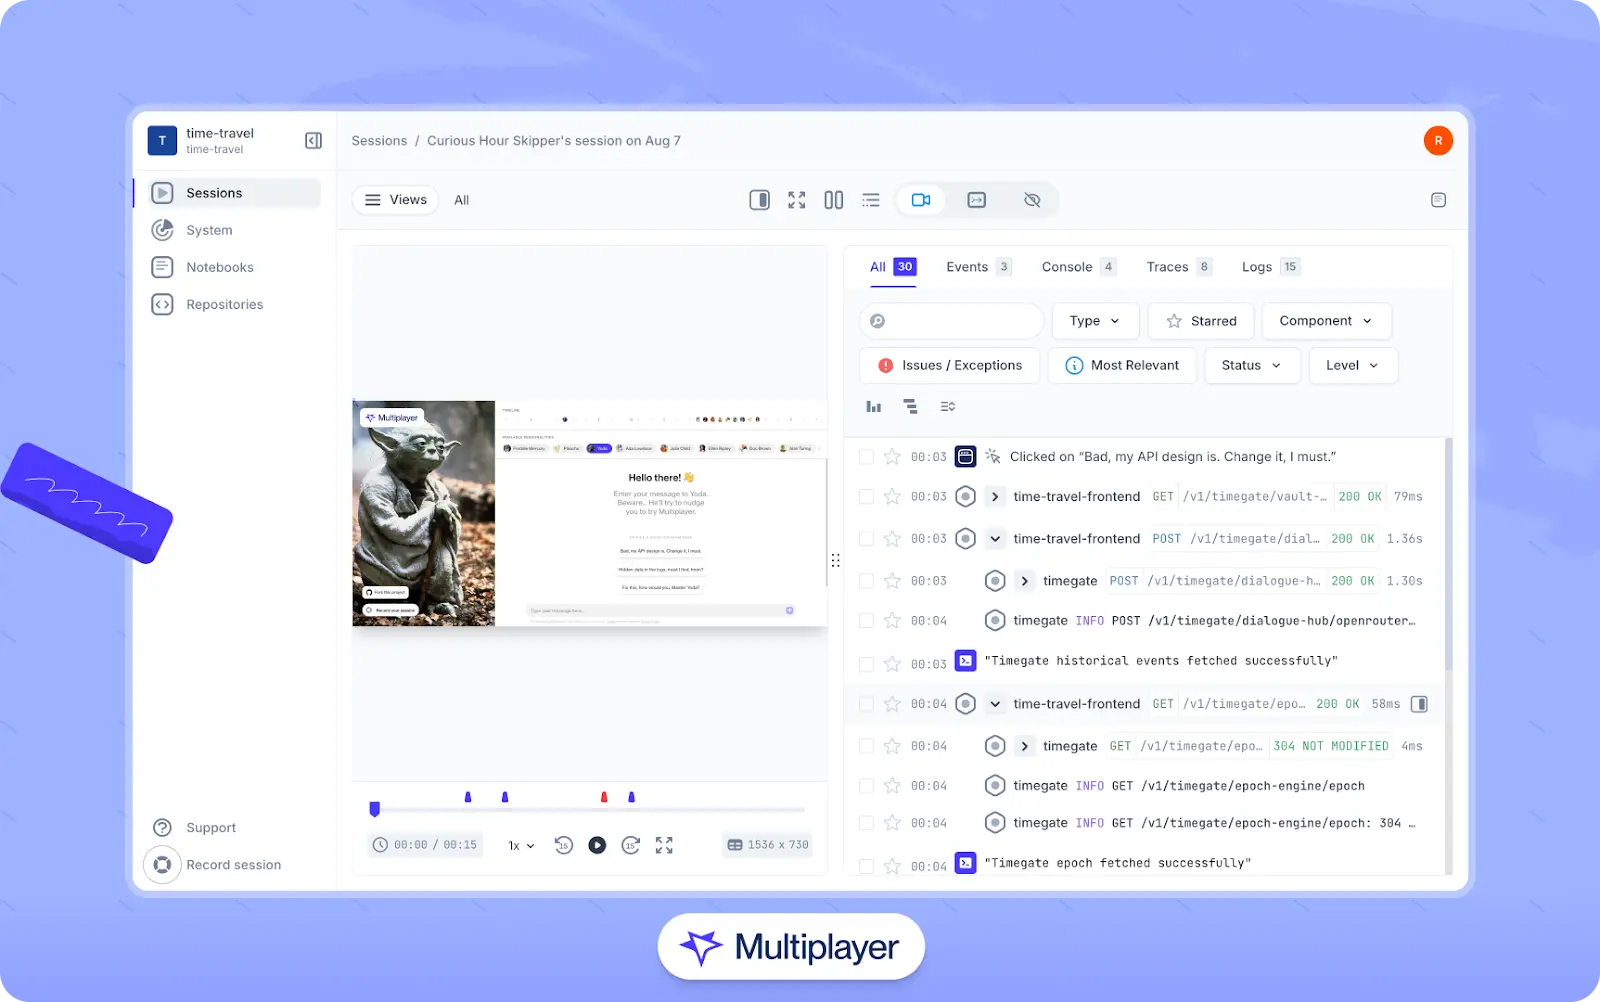
Multiplayer’s full stack session recordings
Establish collaborative debugging workflows
One important aspect of distributed tracing is collaboration across different teams. Having standardized debugging workflows helps teams work together efficiently when issues arise.
Create a standard process for capturing and sharing trace data during incidents. Engineers should know how to access relevant traces and share them with teammates, ensuring that everyone has the same context when debugging by doing the following:
- Identifying affected transactions through monitoring alerts
- Locating corresponding trace IDs from logs or trace search
- Sharing complete trace data with the incident response team
- Annotating traces with findings during investigation
Document examples of both standard and issue traces in your team wiki. This builds a reference library that helps new team members recognize what normal and anomaly patterns look like in your system.
Multiplayer’s full stack session recordings make this kind of collaboration seamless by combining trace data, logs, and frontend events into a single, interactive view. With everything in one place, teams can correlate backend telemetry with user-facing screens and actions, dramatically reducing time to resolution and making cross-functional debugging more intuitive and effective. Data captured by recordings can also be used as input to copilots and AI IDEs to give these tools the context they need to generate better fixes, tests, and features.
Stop coaxing your copilot. Feed it correlated session data that’s enriched and AI-ready.
START FOR FREEConclusion
Throughout this guide, we've seen that distributed tracing gives us tools for debugging in complex environments, from guesswork to precision. Connecting the missing dots between services tells the complete story behind each request.
These insights give you an observability practice that scales with your architecture:
- End-to-end request visibility is essential for understanding behavior in distributed systems.
- Traces, spans, and context propagation form the base of practical observability.
- Proper instrumentation balances coverage with performance impact.
- Sampling strategies must be upgraded with your system's scale and complexity.
- Integration with logs and metrics creates a comprehensive observability approach.
- Collaborative debugging workflows accelerate incident resolution.
To deepen your knowledge of distributed tracing, you can explore these resources:
- OpenTelemetry Documentation: Comprehensive guides for instrumentation across languages
- W3C Trace Context Specification: The standard for context propagation
For teams seeking to accelerate their tracing implementation, platforms like Multiplayer simplify the process with automatic service discovery, end-to-end session capture, and collaborative debugging tools that connect frontend and backend telemetry.