Guide
Observability Framework
Table of Contents
Failures in complex distributed systems are inevitable, and finding their root causes can be difficult. Traditional monitoring tools are proficient at tracking predefined metrics and identifying known problems, but they often struggle to diagnose unpredictable events. Static dashboards and reactive alerts prove insufficient when addressing novel issues, such as sudden latency spikes across numerous microservices or cascading failures that disrupt entire user flows.
Observability offers a more comprehensive approach and represents a shift in how teams understand system behavior. It helps teams investigate complex scenarios by asking new, ad hoc questions of systems and receiving timely, accurate answers. However, effective observability requires a framework: a structured approach that defines what data to collect, how to analyze it, and how to turn insights into actionable feedback.
In this article, we discuss the practical steps in implementing an observability framework that is team-centric, cost-aware, and built for scale. We explore why organizations need an observability framework, its core components, and practical steps for its implementation.
Summary of key observability framework concepts
| Concept | Description |
|---|---|
| Why implement an observability framework? | Observability enables faster root-cause analysis, reduces MTTR, improves the user experience, and optimizes overprovisioned resources. |
| Key components of an observability framework | A practical framework includes instrumentation (e.g., OpenTelemetry and custom logs), data correlation (linking logs, metrics, and traces for root cause analysis), and integration with tooling (dashboards, alerts, automation, etc.). These elements enable faster troubleshooting and system optimization. |
| Why choose OpenTelemetry? | OpenTelemetry is vendor-neutral, supports all observability signals, and offers open-source instrumentation across the stack. It enables cross-team collaboration with rich context for developers and production insights for DevOps. |
| Steps for implementation | To implement observability, start by assessing critical services and defining SLOs, then instrument systems using OpenTelemetry. Finally, integrate tooling with an analysis backend and shared dashboards. |
Why implement an observability framework?
In distributed systems, services often degrade in subtle and unpredictable ways. These failure characteristics necessitate a shift from traditional monitoring to a practical observability framework that can equip engineering teams with actionable, contextual data.
The true value of observability shows up in how teams respond to incidents. When data is fragmented across dashboards, log files, and infrastructure tools, engineers spend precious time stitching together clues. In contrast, with a strong observability framework, they have a single, coherent view of what’s happening and why.
Besides reducing time to resolution, this can improve the actual quality of fixes. Teams move beyond surface-level solutions, like restarting services, and instead solve the actual problem. As a result, recurring incidents decrease and system reliability improves. In addition, observability helps teams catch subtle performance regressions before they affect users and supports smarter engineering decisions by making system behavior more transparent..
Finally, effective observability empowers the entire development team—not just Ops or SREs—to take ownership of the system’s health and reliability. When developers have access to meaningful data, they can understand how their code behaves in production, quickly diagnose issues, and build more resilient features from the start.
Key components of an observability framework
Now that we have seen the value that observability can provide, let’s explore how an effective observability framework can be constructed. Such a framework consists of several interconnected components that transform raw system data into actionable insights and ensure that each layer of the observability pipeline is composable, standards-driven, and contextually tuned. The following sections outline these components as they apply to production environments.
Telemetry data
Observability starts with capturing the core signals: logs, metrics, and traces. Each plays a distinct role in understanding system behavior.
Logs record discrete, timestamped events as structured or semi-structured data, detailing occurrences and their timing. For example:
ERROR: PaymentService timed out at 2024-05-12T14:32:00ZMetrics are time-series data representing numeric values (e.g., rates, counts, gauges): checkout_failures{reason="payment_declined"} 15
Traces track request flows across services, revealing duration, dependencies, and latency bottlenecks:
{
  "trace_id": "def789ghi012",
  "spans": [
    {
      "span_id": "1",
      "name": "HTTP POST /checkout",
      "service": "api-gateway",
      "start_time": "2024-05-12T14:31:50Z",
      "duration_ms": 200,
      "status": "error",
      "error_message": "HTTP 500 Internal Server Error",
      "parent_span_id": null
    },
    {
      "span_id": "2",
      "name": "Validate Cart",
      "service": "cart-service",
      "start_time": "2024-05-12T14:31:51Z",
      "duration_ms": 20,
      "status": "ok",
      "parent_span_id": "1"
    },
    {
      "span_id": "3",
      "name": "Authorize Payment",
      "service": "payment-service",
      "start_time": "2024-05-12T14:31:52Z",
      "duration_ms": 150,
      "status": "error",
      "error_message": "timeout",
      "parent_span_id": "1"
    }
  ]
}
The log, metric, and trace examples show a POST /checkout request flowing through multiple services. The cart service responds quickly and without issue, but the payment service times out during authorization, triggering an error in the API gateway. In this scenario, logs capture the timeout, metrics show a spike in failed checkouts, and the trace pinpoints the failing component and its impact.
Instrumentation
To collect appropriate telemetry data, teams must instrument code or use tools to automatically capture meaningful system information.
OpenTelemetry has become an industry standard for this use case. It offers auto-instrumentation for many different integrations, such as web frameworks, databases, messaging systems, cloud platforms, etc. The primary value of OpenTelemetry is that it standardizes how telemetry data is captured and shared, regardless of the underlying technologies. This simplifies processes like correlation and analysis down the line.
Full-stack session recording
Learn more


Data ingestion, transport, and storage
Telemetry collection is insufficient in isolation; data must be reliably transported to the backend systems at the required scale. This involves two key processes:
- Ingestion tools (e.g., Fluentd, the OpenTelemetry Collector, or Prometheus exporters) to manage data intake
- Transport layers (e.g., Kafka and the OpenTelemetry Protocol) to efficiently buffer and transmit telemetry, thereby ensuring data durability and throughput
Once data has been processed, it must be stored appropriately. Different signal types require storage solutions that are optimized for different data characteristics.
Metrics
Metrics require rapid, high-cardinality read access. Prometheus accommodates this by scraping OpenTelemetry metrics exposed through endpoints. For example, OpenTelemetry metrics in the Prometheus format appear as:
# HELP http_requests_total The total number of HTTP requests
# TYPE http_requests_total counter
http_requests_total{method="GET",handler="/api"} 1027
http_requests_total{method="POST",handler="/submit"} 3
Logs
Logs store searchable, semi-structured data. Elasticsearch enables complex queries on logs collected via OpenTelemetry. A simple Elasticsearch query for logs containing an error might be:
{
  "query": {
    "match": {
      "log.level": "error"
    }
  }
}
Traces
Traces typically generate more data than metrics or logs because they contain individual request paths, timings, and contextual information. Because of this, they require scalable storage solutions optimized for fast retrieval. Tools like Jaeger and Tempo use specialized databases or object stores to handle this complexity.
Data correlation
Raw telemetry data becomes valuable when it is properly correlated. Developers must be able to understand the relationship between a spike in one signal and corresponding behaviors in others.
A common way to integrate metrics, logs, and traces is through OpenTelemetry’s Baggage feature, which attaches key-value metadata to requests that propagate across services. For example, the code below creates and attaches user and experiment metadata to the request context, starts a trace span using that context, and accesses the metadata within the span to enrich logs or metrics:
import { propagation, context, trace } from '@opentelemetry/api';

// Create and attach baggage with user and experiment info
const baggage = propagation.createBaggage({
  'user_id': { value: '12345' },
  'experiment_group': { value: 'variant_b' }
});
const ctx = propagation.setBaggage(context.active(), baggage);

// Start a trace span with baggage context
const tracer = trace.getTracer('example');
tracer.startActiveSpan('checkout', {}, ctx, (span) => {
  const bag = propagation.getBaggage(context.active());
  console.log(`User ${bag.getEntry('user_id').value} in ${bag.getEntry('experiment_group').value} started checkout`);
  span.end();
});
This context travels with the trace and helps developers correlate telemetry data, filter it, and ultimately debug the underlying system more effectively.
Visualization and dashboards
Dashboards turn telemetry into perspective. For example:
- Grafana helps visualize real-time service health, P99 latency breakdowns, and SLO breaches.
- Kibana makes it easier to spot log anomalies, error spikes, and usage trends across time and services.
- Multiplayer’s system dashboard summarizes telemetry data across platforms, components, APIs, and dependencies to provide a unified view of the system.


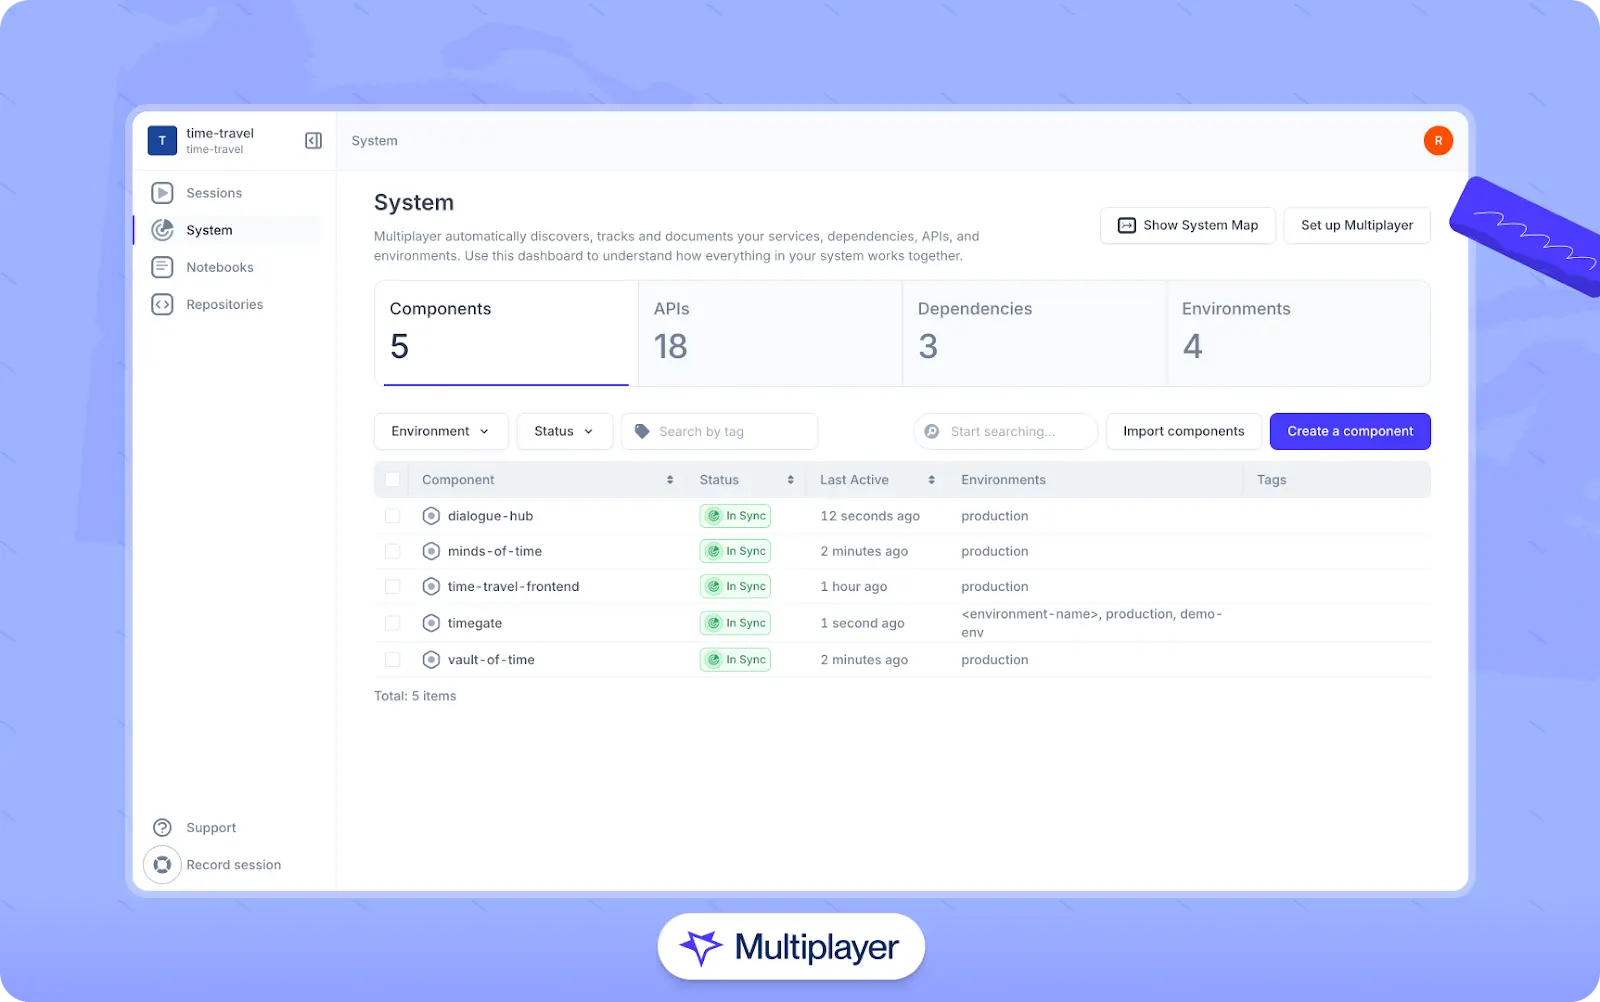
Multiplayer’s system dashboard
Interact with full-stack session recordings to appreciate how they can help with debugging
EXPLORE THE SANDBOX(NO FORMS)
In addition, visuals such as latency heatmaps segmented by geographic region can highlight anomalies like CDN misconfigurations affecting isolated zones—patterns not easily discernible from raw logs alone. Visualizations should be employed not merely for reporting, but for correlation. They should help teams identify relationships between signals and pinpoint root causes across systems.
Alerting and notification
Effective alerts are characterized by precision, timeliness, and actionability. Three common types are:
- Threshold alerts that are activated when predefined thresholds are breached (e.g., an error rate > 5%)
- Anomaly detection, which employs statistical or machine learning tools to identify atypical patterns
- SLO-based alerts, which track error budget burn rates to prevent alert fatigue and focus on user-impacting issues
The objective is not merely uptime; it is also to maintain service reliability without overwhelming teams with excessive, non-actionable notifications.
Security and compliance
Telemetry often includes sensitive metadata, which requires appropriate handling. This often encompasses the following considerations:
- Access controls: Use role-based access control (RBAC) and attribute-based access control (ABAC) to restrict data visibility. Developers might only see anonymized logs, while security teams get full trace access in production. For example, restrict access to customer PII or PCI data using IAM policies or masking rules.
- Audit trails: Log every access request to telemetry data, including the origin and purpose of the query. Tools like centralized log aggregators or SIEM systems can automatically track and alert on anomalous behavior. This practice is particularly significant for incident investigations and compliance audits.
- Retention policies: Set clear rules for how long different data types are stored. For example, error traces may be retained for 30 days, whereas business metrics might be stored for six months.
Applying these security measures is critical because compliance is mandatory for frameworks like GDPR and SOC2. The most effective way to ensure adherence is by automating governance. This involves codifying your security standards, from access rights to retention schedules, into automated lifecycle policies that execute without manual intervention. In this way, you can ensure that your internal standards stay aligned with external regulations over time.
Why OpenTelemetry?
OpenTelemetry (OTel) has become the standard for collecting telemetry data across distributed systems. Its role in a modern observability strategy is pivotal for several practical reasons.
Support for MELT signals
OTel captures MELT signals (metrics, events, logs, and traces) through a consistent framework to reduce data fragmentation and simplify observability. For example, OTel can be used to trace requests across microservices, capture key logs, and record custom metrics linked together through context propagation. This results in a single, consolidated telemetry pipeline.
Consider this simple Python example for creating a trace:
from opentelemetry import trace
from opentelemetry.sdk.trace import TracerProvider
from opentelemetry.sdk.trace.export import BatchSpanProcessor, ConsoleSpanExporter

trace.set_tracer_provider(TracerProvider())
tracer = trace.get_tracer(__name__)

span_processor = BatchSpanProcessor(ConsoleSpanExporter())
trace.get_tracer_provider().add_span_processor(span_processor)

with tracer.start_as_current_span("checkout_operation"):
    print("Handling checkout...")
Any logs or metrics generated within the span’s context are automatically correlated, making it easier to investigate performance issues or failures.
One click. Full-stack visibility. All the data you need correlated in one session
RECORD A SESSION FOR FREEVendor-neutral and open source
OpenTelemetry is vendor-agnostic and supports a wide range of deployment models, including on-premises, cloud, and hybrid environments. It works across most languages and runtimes, allowing teams to instrument their systems without being tied to a specific vendor or platform.
Integration with external tools
OpenTelemetry data becomes more useful when exported to visualization and analysis platforms. For instance, Multiplayer integrates with OpenTelemetry to support collaborative debugging, visualizing service relationships, and investigating anomalies across systems.
Impact across engineering roles
OpenTelemetry supports workflows that extend beyond DevOps and SRE teams. Developers can use OTel SDKs to trace request flows in staging environments, helping them identify issues before deployment. QA teams can correlate structured logs from automated tests with recent changes to catch regressions early, and architects can review real traffic traces to understand evolving service dependencies and detect unwanted coupling.
Implementing an observability framework
Now that we have explored the history of observability, its key components, and OpenTelemetry’s role, let’s build a structured observability framework. The goal is not just to collect data but to establish a platform that fosters a shared, real-time understanding of the system’s health and behavior. The following is a practical, step-by-step approach to building such a framework.
Phase 1: Assessment and planning
Start by identifying operational priorities and the system landscape. Map critical services, such as customer-facing services and systems that represent single points of failure. Tools like Multiplayer can help automate this process.
Next, define clear SLOs such as latency thresholds, error rates, and availability targets. For example:
- Latency: 95% of requests serviced in < 300ms
- Error Rate: < 1% 5xx responses
- Availability: 99.9% uptime per month
Finally, review current monitoring tools and the data they collect to identify gaps in visibility and potential areas for improvement.
Phase 2: Instrumentation and data collection
With a clear understanding of critical services and SLOs in place, the next step is to ensure consistent and comprehensive telemetry collection across your system. Instrument applications to emit the necessary telemetry data (traces, metrics, logs) by deploying OTel SDKs or agents to collect telemetry consistently across services built in different languages (e.g., Node.js, Go, Python, Java, etc.).
For example, a Node.js service can be instrumented to emit traces and metrics to a centralized collector:
const { NodeSDK } = require('@opentelemetry/sdk-node');
const { getNodeAutoInstrumentations } = require('@opentelemetry/auto-instrumentations-node');
const { OTLPTraceExporter } = require('@opentelemetry/exporter-trace-otlp-http');

async function startTracing() {
  const sdk = new NodeSDK({
    traceExporter: new OTLPTraceExporter({
      url: 'http://localhost:4318/v1/traces',
    }),
    instrumentations: [getNodeAutoInstrumentations()],
  });

  try {
    await sdk.start();
    console.log('Tracing initialized');
  } catch (error) {
    console.error('Error initializing tracing', error);
  }
}

startTracing();
This configuration enables automatic instrumentation for supported Node.js libraries and exports trace data to a specified OTel collector. Similar SDKs and agents exist for other languages.
Phase 3: Tooling and integration
Transform collected telemetry into actionable insights by selecting tools to ingest, store, correlate, visualize, alert, and analyze data. The table below associates core observability components with potential tool options.
| Observability component | Possible tooling |
|---|---|
| Instrumentation | OpenTelemetry Collector, Prometheus client libraries |
| Data ingestion and transport | Fluentd, OpenTelemetry Collector, or Prometheus exporters for data intake; Kafka and the OpenTelemetry Protocol (OTLP) or HTTP/gRPC for data transport |
| Data storage and indexing | Prometheus (metrics), Elasticsearch or Loki (logs), Jaeger or Tempo (traces) |
| Data correlation | OpenTelemetry context propagation (TraceContext, Baggage), trace/span IDs |
| Visualization and dashboards | Grafana, Kibana, Multiplayer |
| Alerting and notifications | Prometheus Alertmanager, Grafana Alerts, external integrations (Slack, PagerDuty, etc.) |
| Analytics and root cause analysis | Multiplayer full-stack session recordings, Grafana, Kibana |
| Security and compliance | RBAC, TLS encryption, data redaction (via OTel Collector), audit logging |
| Governance and standards | OpenTelemetry semantic conventions, custom schema registries, naming/tagging policies |
Stop coaxing your copilot. Feed it correlated session data that’s enriched and AI-ready.
START FOR FREEPhase 4: Documentation and debugging
Next, utilize collected telemetry to improve system documentation and streamline debugging processes. Instead of relying on outdated manual diagrams, teams can generate real-time architecture maps using telemetry data. Using platforms like Multiplayer, you can automate documentation by generating service maps that reflect the current state of the system. Components are labeled by status—such as synchronized, missing, or newly detected—to help keep architectural views up to date and aid in debugging.
For debugging and root cause analysis, Multiplayer supports full-stack session recordings that link frontend screens to traces, logs, and metrics in a unified interface. This allows engineers to follow issues from front-end requests through backend services more efficiently.

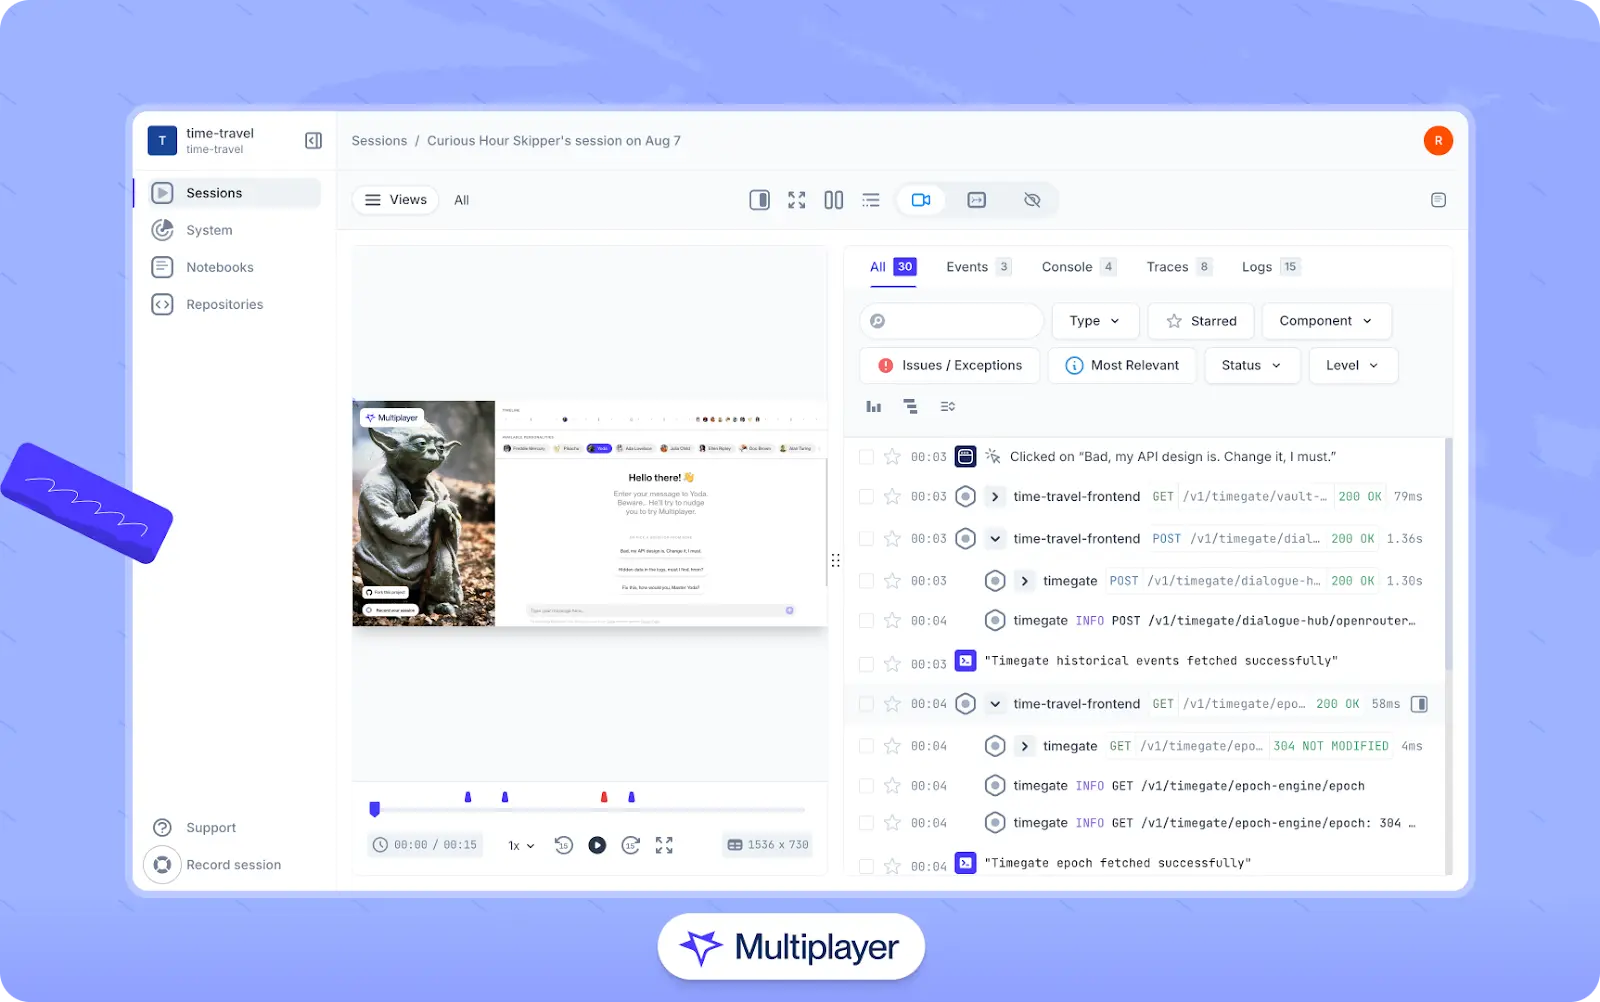
Multiplayer’s full-stack session recordings
Phase 5: Scaling and optimization
Continuously iterate on and expand your observability practice as your systems and organization grow. Some key practices include the following:
- Refine alert policies by using historical performance baselines to set intelligent, adaptive alert thresholds
- Auto-suppress alerts during maintenance windows or cascading failures
- As external integrations are added, monitor third-party APIs separately to avoid masking upstream issues. Use synthetic checks, timeouts, and fallback logic to isolate failures early
- Instrumenting internal tools, including those used for deployments or CI pipelines, to gain broader operational insight
You can also use observability signals to trigger automated workflows and remediation actions. For example, you can automatically roll back a problematic deployment if error rates spike beyond SLO thresholds, or you can configure auto-scaling based on sustained CPU usage or message queue length. The overall goal is to manage the system proactively without overwhelming teams with excessive alerts.
Final thoughts
Implementing an observability framework represents a cultural shift, not just a technical change. It requires embracing transparency, investing in shared understanding, and treating reliability as a collective responsibility. Effective observability means transforming raw telemetry into meaningful signals and evolving dashboards into context-rich analytical tools.
Platforms like Multiplayer support this evolution by integrating telemetry data with real-time architecture maps and service metadata, helping bridge the gap between data and actionable insights.
Ultimately, the success of any observability framework depends on building habits and workflows that promote shared visibility, reduce silos, and support fast, confident responses to system changes and failures.