Why observability tools are missing critical debugging data (no matter how you sample)
There's a common belief in the observability space: if you just collect more data, you'll have what you need to debug any issue. The reality is more frustrating: even with 100% unsampled observability, you're still missing critical debugging data.


There's a common belief in the observability space: if you just collect more data, you'll have what you need to debug any issue.
The reality is more frustrating: even with 100% unsampled observability, you're still missing critical debugging data.
The problem isn't sampling. It's what observability tools are designed to capture in the first place.
What observability tools actually collect
Traditional observability platforms (Datadog, New Relic, Dynatrace, Grafana, etc.) are excellent at their core job: monitoring distributed systems. They collect:
- Traces: The path a request takes through your services
- Logs: Events and errors from your applications
- Metrics: System health, latency, error rates
This gives you visibility that something happened and where it happened. You can see that Service A called Service B, the call took 250ms, it returned a 500 error and that the error rate spiked at 14:23 UTC.
For traditional monitoring and alerting, this is great. But for debugging complex issues, especially if you’re leveraging AI coding assistants, this data is incomplete.
The three data gaps that sampling doesn't fix
Gap 1: Request/response payloads for internal services
Observability tools capture HTTP metadata (method, URL, status code, response time) and trace headers for correlation. However, they don't capture the actual request and response bodies: the JSON payloads, form data, or API responses your services exchange.
Why this matters:
When a checkout fails with a 400 error, you can see that the /api/checkout endpoint failed. But you can't see:
- What data was in the checkout request (cart contents, payment method, shipping address)
- What validation error was returned in the response body
- What custom headers were passed (tenant ID, feature flags, API version)
The sampling myth:
Making your traces unsampled (capturing 100% instead of 1-10%) doesn't solve this. You still only get metadata, not payloads. You're just getting metadata for every request instead of a sampled subset of requests.
How teams work around this:
Custom logging. You manually instrument your code to log payloads:
logger.info("Checkout request", extra={"body": request.json()})
This works, but:
- Requires instrumentation in every service
- Creates massive log volumes (and costs)
- Lives in a separate tool from your traces
- Requires manual correlation with your other data
Gap 2: External API calls are black boxes
Your observability tools can tell you that your backend called Stripe, Twilio, or AWS. The call took some amount of milliseconds. It succeeded or failed. However, they don't capture:
- What you sent to the external API
- What the external API returned
- Error details from the external service
Why this matters:
A payment fails. Your trace shows:
POST /api/checkout → calls Stripe → 400 error → returns error to user
But you can't see:
- The payment payload you sent to Stripe (amount, currency, customer ID)
- Stripe's error response ("Currency mismatch: customer configured for EUR, request sent USD")
- Whether retry logic was triggered
The sampling myth:
Unsampled observability still sees external APIs as opaque boxes. Distributed tracing stops at your system boundary. To see what Stripe returned, you need to:
- Log into Stripe's dashboard
- Search by timestamp or customer ID
- Manually correlate with your trace
How teams work around this:
Manual logging before and after every external call:
logger.info("Calling Stripe", extra={"payload": stripe_data})
response = stripe.Charge.create(**stripe_data)
logger.info("Stripe response", extra={"response": response.to_dict()})
This is tedious, error-prone, and easy to forget, especially for one-off integrations.
Gap 3: Frontend context is disconnected
Many observability tools focus only on backend traces and logs. However, some also have RUM / session replay functionalities in their toolkit (e.g. Datadog RUM) or integrations with third-party frontend tools (e.g. Sentry, LogRocket, etc.).
Ultimately, however, obtaining full stack visibility is not as simple as it may seem: it requires more tooling instrumentation, maybe a separate subscription and, oftentimes, manual ID correlation.
In short, you don’t always get an automatic correlation between "what the user did" and "what happened in the backend."
Why this matters:
A user reports: "Checkout is broken." You need to:
- Get the timestamp from the session replay
- Find the corresponding backend trace by matching timestamps (hoping there's no clock skew)
- Correlate the request ID if it was propagated (often it wasn't)
The sampling myth:
Even with 100% unsampled backend traces and full frontend session capture, correlation is still manual. The tools don't automatically link "this user session" to "these backend traces" unless you've explicitly propagated session IDs everywhere and configured correlation across platforms.
The complexity trap
Here's what happens when teams try to solve these gaps with traditional observability tools:
Level 1: Observability (sampled)
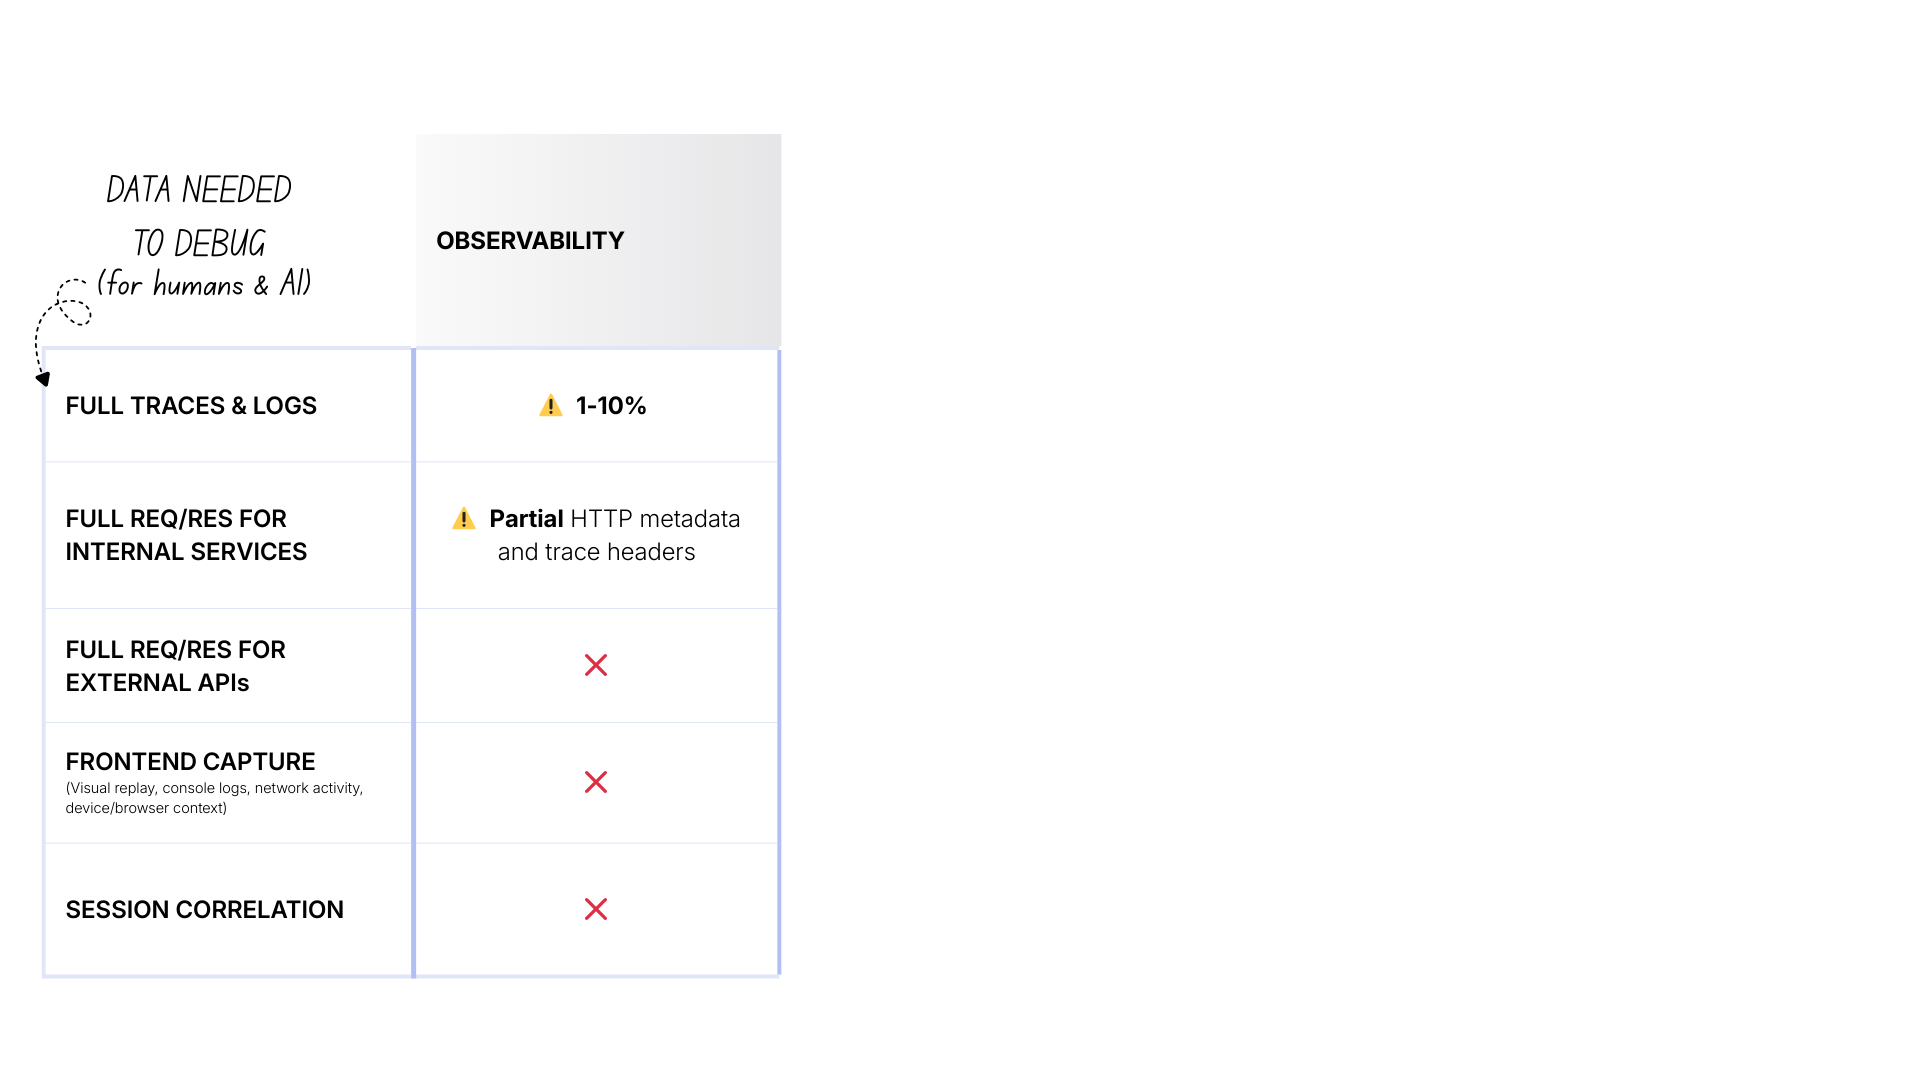
- Cost: $ (manageable)
- Traces & logs: 1-10% sampled
- Internal payloads: ❌ By default, you capture only metadata about the request (method, URL, status)
- External APIs: ❌ Black boxes
- Frontend: ❌ No visibility
- Correlation: ❌ No
Level 2: Observability + RUM
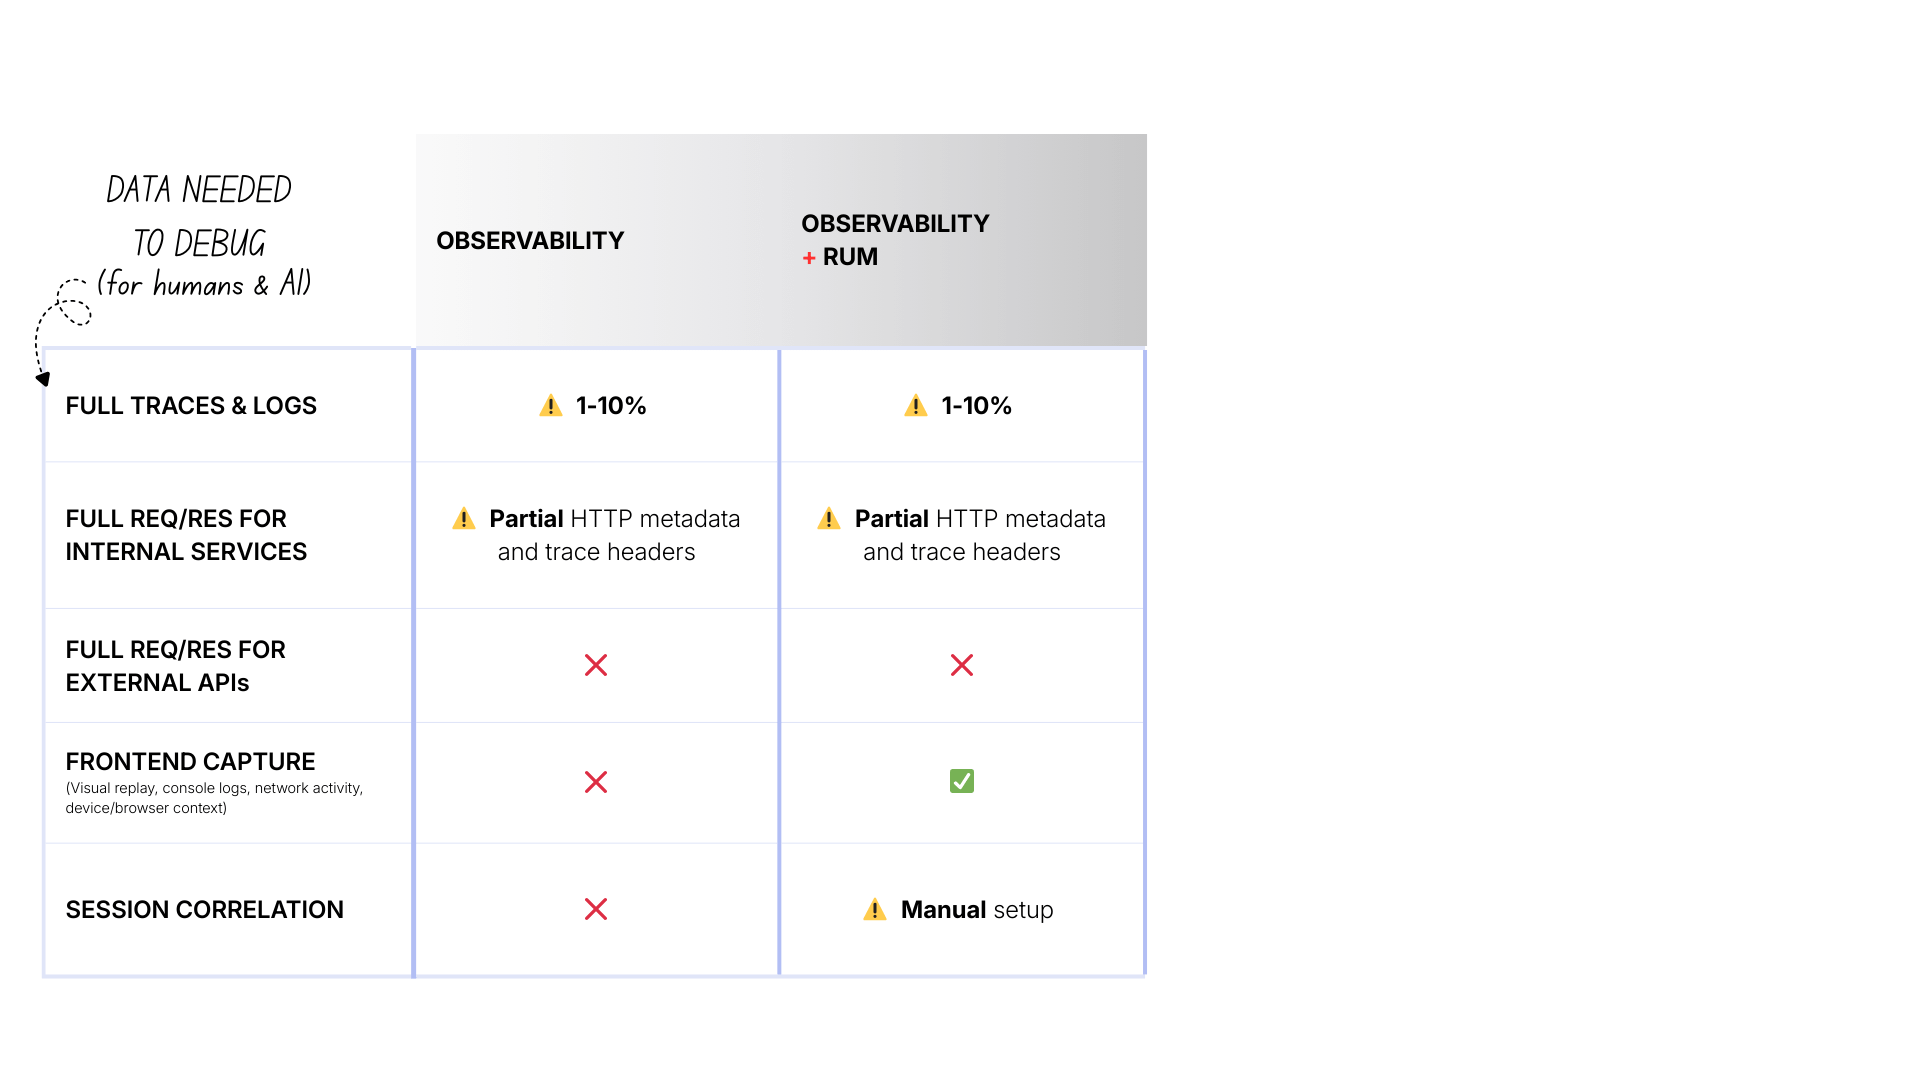
The main differences are:
- Cost: $$ (increased due to more tools and instrumentation overhead)
- Frontend: ✅ Visual replay, console logs, browser network, etc.
- Correlation: ⚠️ Manual setup required to propagate session IDs, configure tools, etc.
Level 3: Unsampled observability + RUM
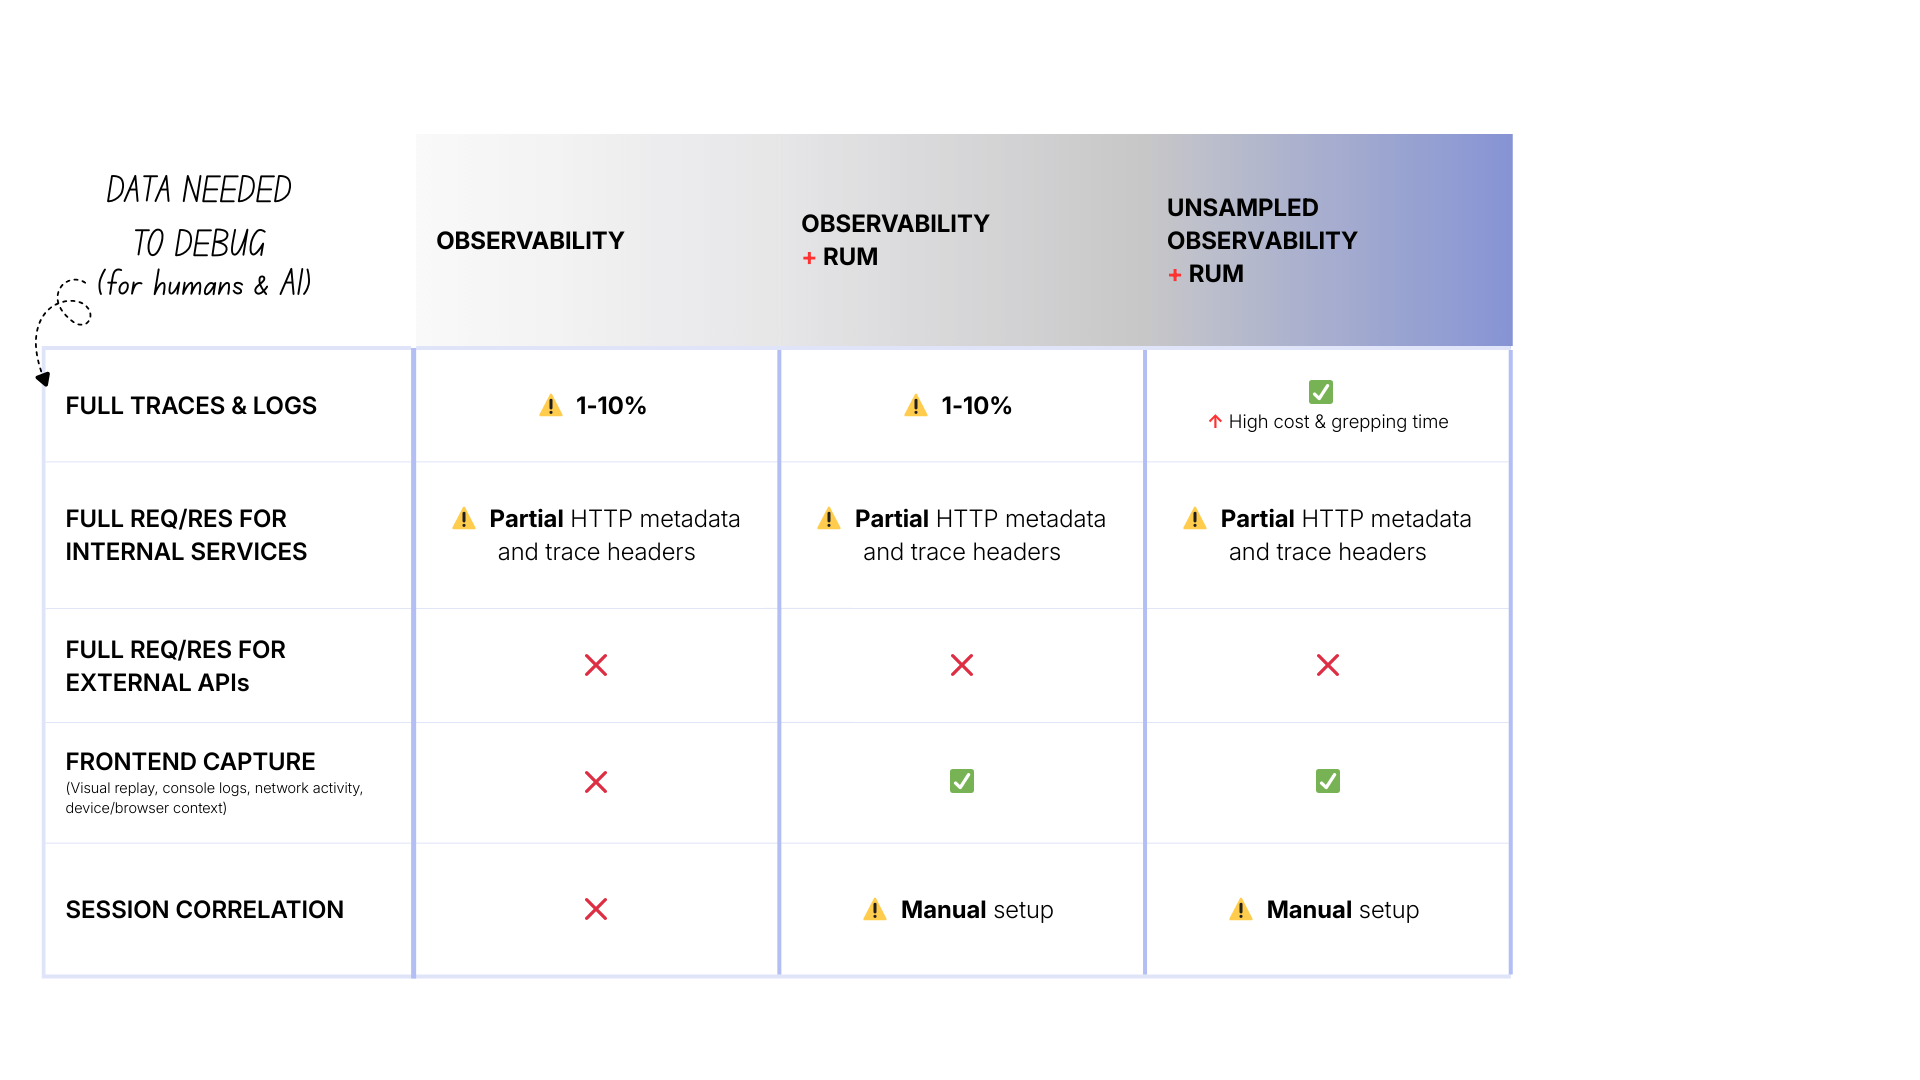
The main differences are:
- Cost: $$$ (high, you’re ingesting and storing 10-100x more data)
- Traces & logs: ✅ 100% captured
Level 4: Unsampled observability + RUM + custom payload logging
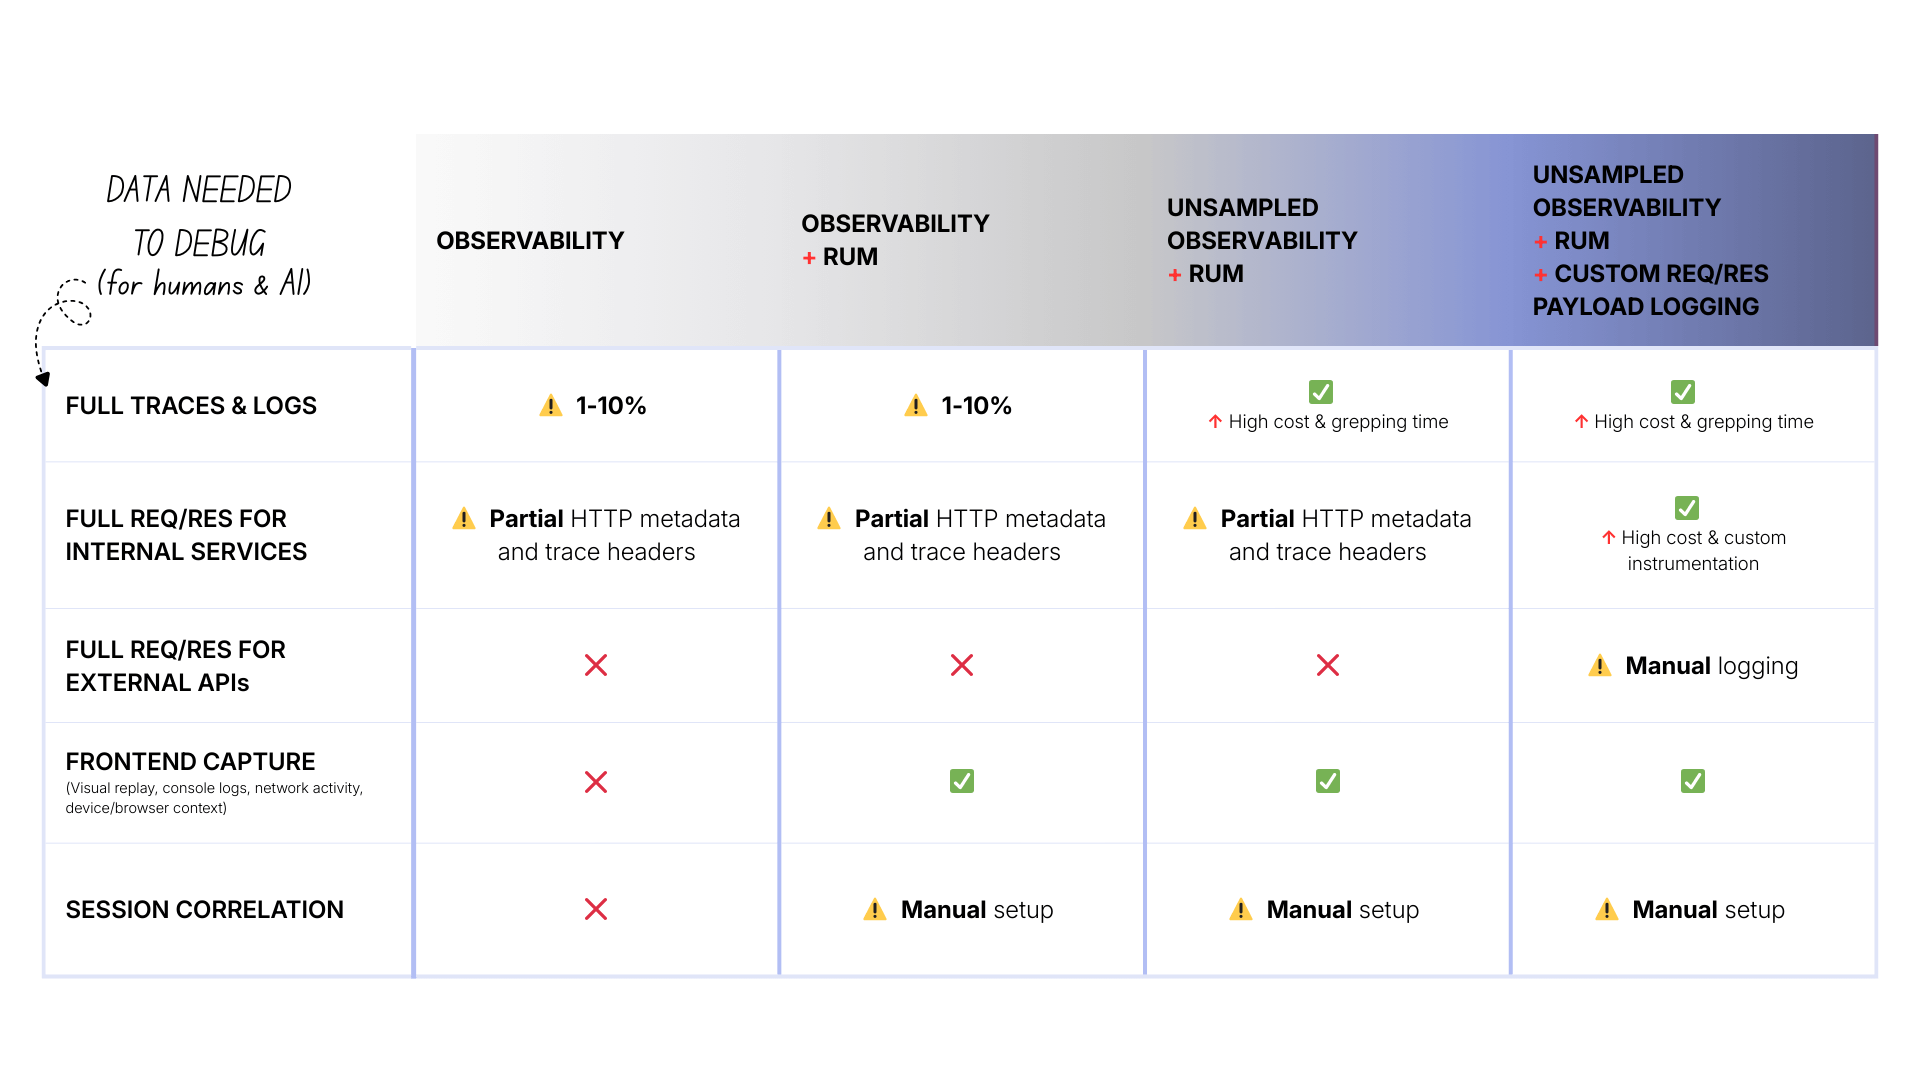
The main differences are:
- Cost: $$$$ (very high—now logging full payloads for everything)
- Internal payloads: ✅ Available (if you instrumented it)
- External APIs: ⚠️ Available (if you manually logged every call)
Notice the pattern: complexity and cost increase, but fundamental gaps remain.
What's needed instead: auto-correlated, session-based capture
The problem with traditional observability is the collection model itself: "collect everything, all the time, hope you have what you need later."
There’s a different approach:
- Collect on-demand: Don't record every request. Record specific sessions where you need visibility (user-reported bugs, errors, failed transactions).
- Capture everything for those sessions: When you do record, get the complete picture: full traces, request/response payloads (internal and external), frontend context, all automatically correlated.
- Store it together: Don't split data across observability (traces), logging (payloads), RUM (frontend), and external dashboards (Stripe). Keep it in one place, already linked.
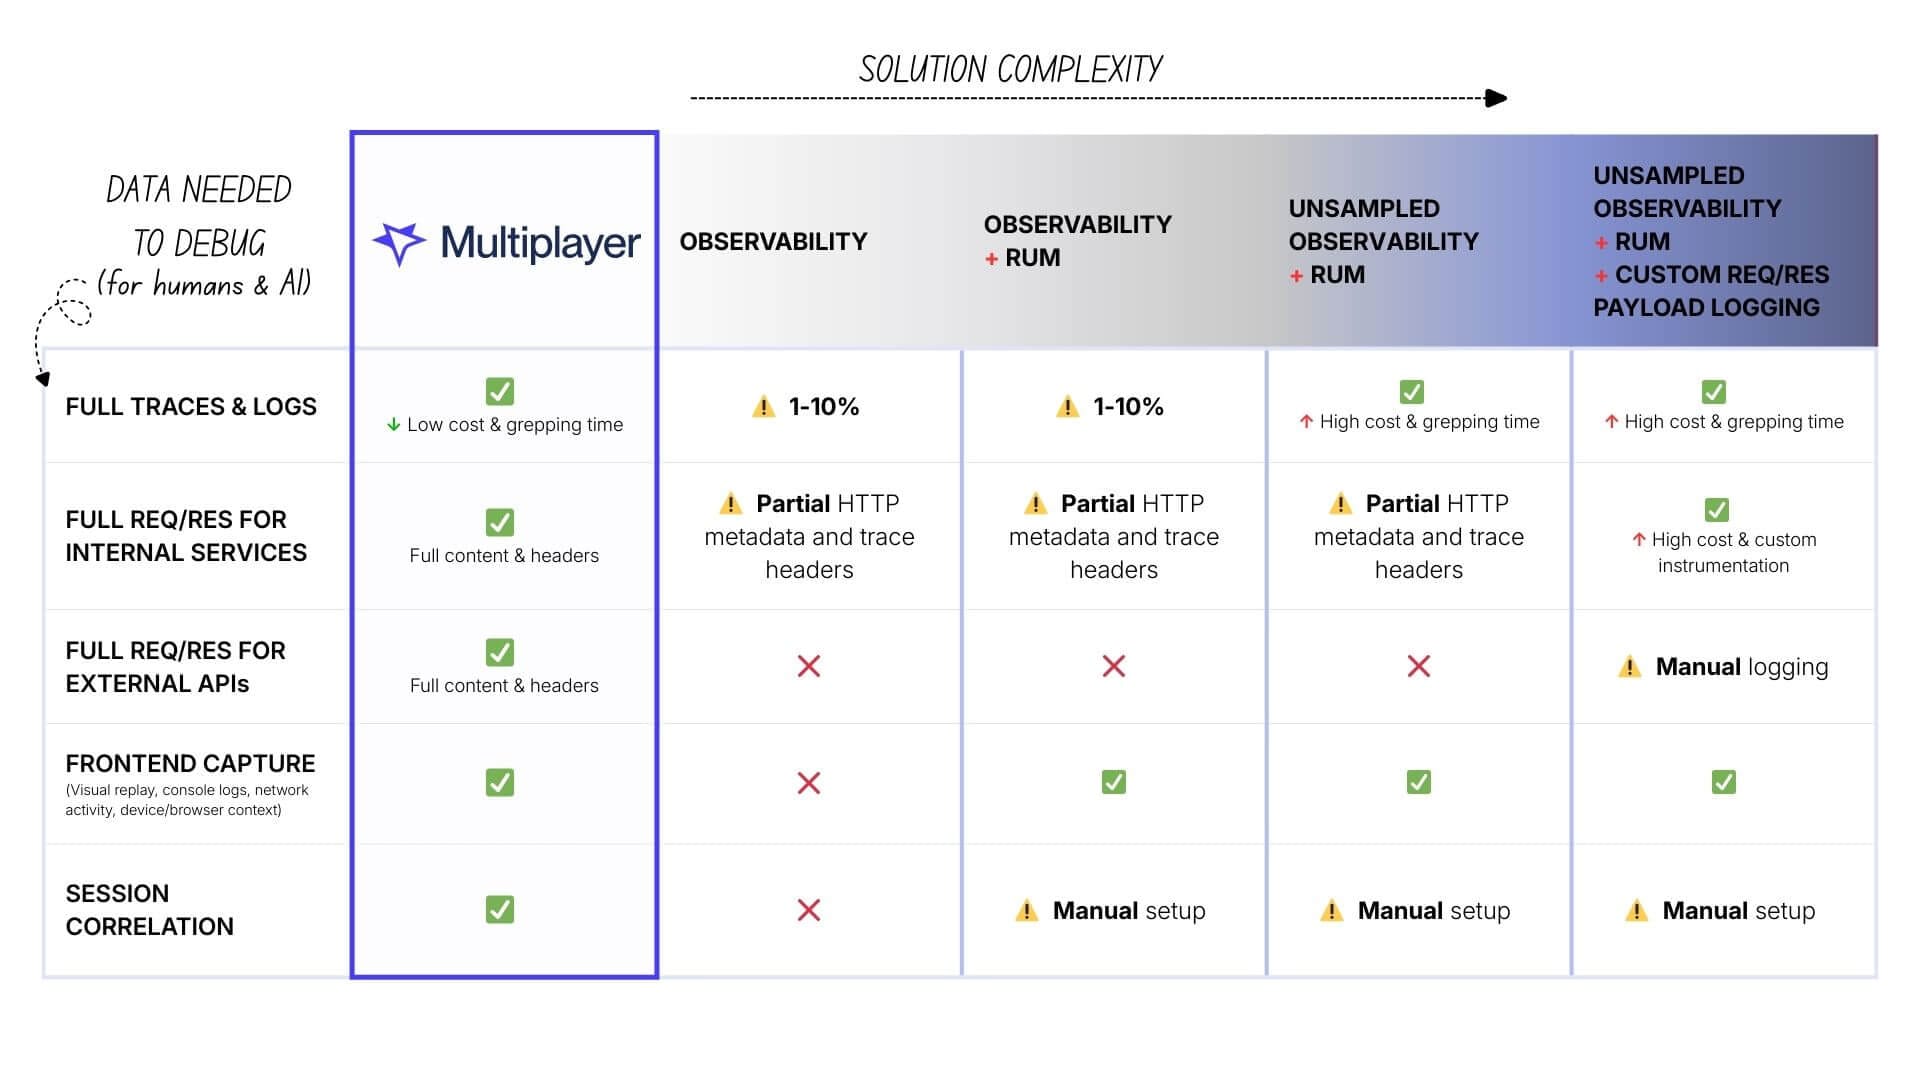
This is what tools like Multiplayer, with its session-based recording, are built for:
- Cost: $ (low: only recording specific sessions, not all traffic)
- Traces & logs: ✅ Unsampled per session
- Internal payloads: ✅ Full content & headers out of the box
- External APIs: ✅ Full content & headers (Stripe, Twilio, AWS), out of the box
- Frontend: ✅ Full capture (visual replay, console, network, device info)
Correlation: ✅ Automatic (everything linked by session)
The benefit for humans and AI tools
Having auto-correlated, full-stack data matters even more when you're using AI to debug.
AI tools and agents are only as good as the data you give them. When you paste a stack trace and some logs into Copilot or Claude, the AI pattern-matches against common issues. It's guessing based on incomplete information.
But if you can give the AI:
- The full user journey (what they clicked, in order)
- The exact request the frontend sent
- What your backend received and how it processed it
- What you sent to Stripe and what Stripe returned
- Where in that chain it broke
...now the AI can provide specific diagnosis based on what actually happened in your system.
Getting that complete picture with traditional observability, even unsampled, is much more costly, time-consuming and effort-intense. You'd need to manually gather fragments of information from multiple data silos and tools and then paste them all in.
The path forward
If you're an engineering leader evaluating observability tools, ask these questions:
- What does it cost to have complete, unsampled data for the requests I care about?
- If the answer involves "collect everything 24/7," the cost will be prohibitive at scale.
- Can this tool capture request/response payloads for internal services without custom instrumentation?
- If no, you're signing up for ongoing instrumentation work and incomplete coverage.
- Can this tool automatically capture what I send to and receive from external APIs (Stripe, Twilio, AWS)?
- If no, external services remain black boxes unless you manually log every call.
- Does this tool automatically correlate frontend user sessions with backend behavior?
- If no, you're manually stitching data together during incidents.
The goal isn't more data. It's the right data, captured automatically, already correlated, available when you need it. Whether you're debugging manually or using AI to help.
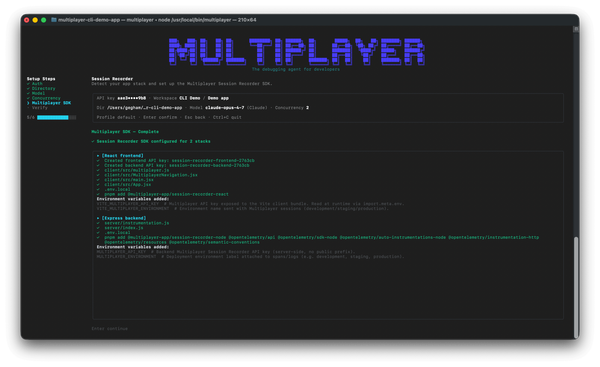
One copy/paste in your terminal and the debugging agent is running:
npm install -g @multiplayer-app/cli && multiplayer
Rather explore first?👇