Why AI can't debug your API integrations (yet)
The next generation of debugging doesn’t depend exclusively on the quality of AI models, but it’s heavily dependent on feeding AI tools the context they need to be useful.


AI coding assistants have transformed how we write code. For example, GitHub Copilot, Cursor, and ChatGPT can generate Stripe integration boilerplate in seconds. They'll scaffold your payment flow, suggest error handling patterns, and even write unit tests.
But when your Stripe integration breaks in production can AI actually help you debug it? The honest answer: not really. At least, not yet.
Here’s why.
The limitation: AI needs context it can't get on its own
When you ask an AI assistant "why is my Stripe payment failing?", it responds with educated guesses based on common patterns:
- "Check if the card is expired"
- "Verify you're using the correct currency format"
- "Ensure you're handling insufficient funds errors"
- "Confirm your API keys are valid"
These are all reasonable suggestions. They're based on what usually causes Stripe payment failures across thousands of codebases the AI was trained on. But the AI doesn't know what actually happened in your specific case. It doesn't have access to:
- What payload did your frontend send to your backend?
- What request did your backend construct and send to Stripe?
- What response did Stripe return?
- How did your backend process that response?
- What error (if any) made it back to the user?
Without this runtime context, the AI is pattern-matching. It's giving you a troubleshooting checklist, not a diagnosis.
The problem: getting context for external APIs is effort-intensive
The irony is that the data AI needs often exists, it's just scattered and difficult to access.
When a Stripe integration breaks, you need to see the complete request/response exchange: what you sent them, what they returned, and how your system handled it. This is where traditional debugging approaches fall short, particularly for external API calls.
APM tools show that you made the call and how long it took, but not the payload exchange. Most Application Performance Monitoring platforms (Datadog, New Relic, Dynatrace) can track that your backend called stripe.charges.create() and that it took 340ms. They might even show it returned a 400 error. But they typically don't capture the full request body you sent or the detailed error response Stripe returned. At least not by default.
In theory, APM tools CAN capture this data IF properly instrumented. You can configure custom spans, add metadata attributes, and enrich traces with payload information. But this requires:
- Configuration complexity: Custom instrumentation for each external API integration
- Cost considerations: Full payload capture dramatically increases data volumes and APM bills
- Intentional redaction: Many teams deliberately avoid logging payment data due to PCI compliance requirements
The result? When debugging external API failures, most teams end up manually gathering context from multiple sources:
- Check your application logs (CloudWatch, Splunk) for what you sent
- Check Stripe's dashboard for their logs of the request
- Check your error monitoring (Sentry, Rollbar) for the exception
- Check your frontend session replay to see what the user experienced
- Manually correlate timestamps, request IDs, and user sessions across all of these
Once you've spent 30-60 minutes gathering this fragmented context, then you can paste it into an AI assistant and ask for help. But at that point, you've already done most of the debugging work yourself.
A real example: the AMEX one-time code bug
Let's walk through a concrete scenario to see where AI debugging breaks down.
The Problem:
After deploying new payment features, customers complain they don't receive one-time authentication codes on their phones when paying with American Express cards. The issue is intermittent and doesn't affect Visa or Mastercard. Engineering teams suspect an authentication bug but can't reproduce it reliably.
Traditional Debugging Workflow
Step 1: Check error monitoring
Sentry shows some frontend timeout errors during checkout, but no clear stack trace pointing to the root cause. The errors are generic: "Request timeout after 30s."
Step 2: Check application logs
Search CloudWatch for logs around the time customers reported issues. Find log entries showing successful calls to Stripe's API, but the logs don't include full request payloads (they were redacted for PCI compliance).
Step 3: Check Stripe's dashboard
Log into Stripe's dashboard and search for the affected transactions by timestamp and customer email. Finally discover that some requests are receiving authentication_required responses, but your system isn't handling them correctly.
Step 4: Reproduce locally
Try to reproduce the issue in staging with test AMEX cards. It doesn't happen consistently. Realize you need to see the actual production payloads to understand the pattern.
Step 5: Add more logging and wait
Deploy additional logging to capture more details about AMEX transactions. Wait for the issue to occur again.
Total time to diagnosis: Hours to days, depending on how quickly the issue reproduces.
At this point, could you ask AI for help? You could paste your fragmented logs and ask "why might Stripe authentication fail for AMEX?". The AI would suggest checking 3DS configuration, webhook handling, and card type compatibility. All reasonable but generic advice.
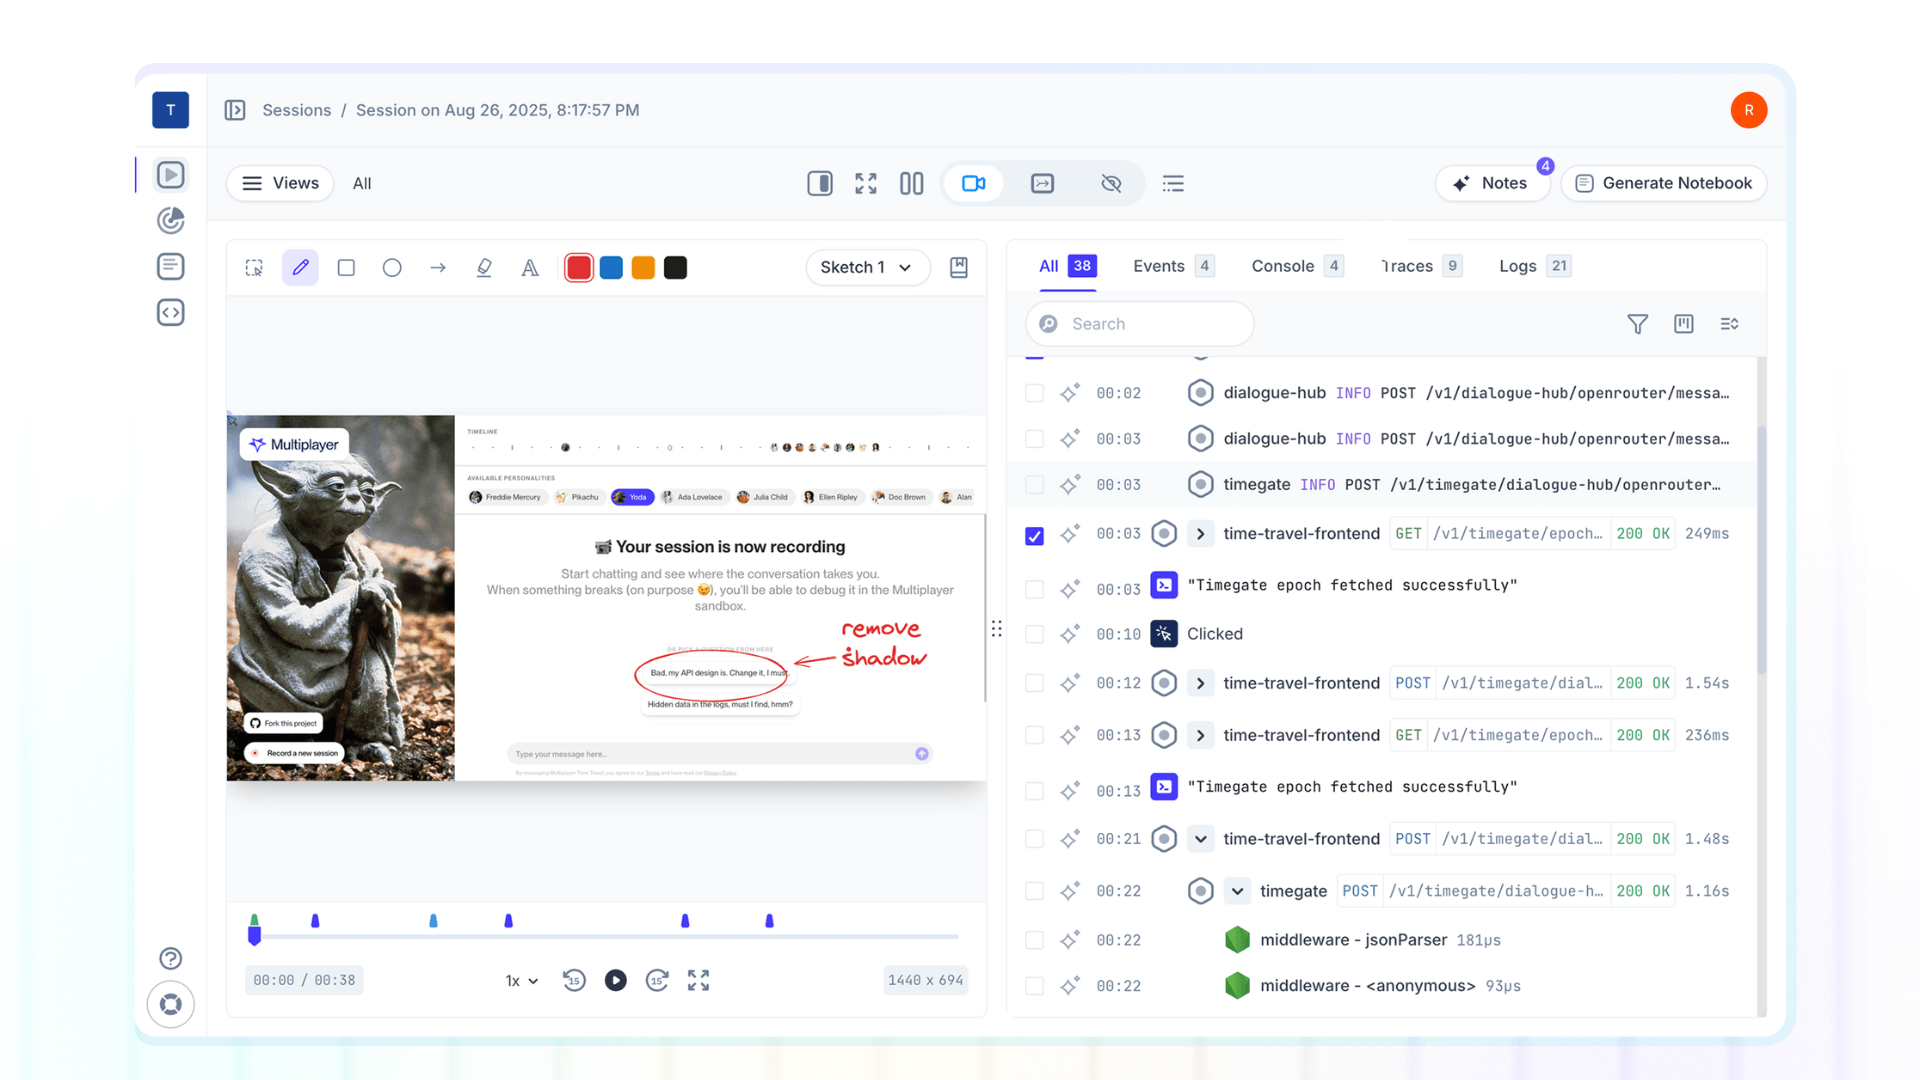
Full stack session recording with auto-correlated API data
Now imagine a different debugging workflow:
- A customer reports the issue
- You pull up the full-stack replay of their session
- You see:
- The exact checkout form they filled out (frontend)
- The API request your backend constructed (
POST /v1/payment_intents) - The full payload sent to Stripe, including the discovery that card numbers for AMEX are getting an extra digit appended (aha! that’s the issue!)
- Stripe's response:
invalid_card_number - How your backend handled this response (incorrectly treating it as a generic timeout)
- What the user saw (spinning loader with no error message)
Total time to diagnosis: 5-10 minutes.
Now when you ask AI for help, you can provide the complete context: "Here's the exact payload we sent to Stripe for AMEX cards. Stripe returned invalid_card_number. Our code is adding an extra digit. Why?"
The AI can now give you a specific answer: "Your string concatenation logic in formatCardNumber() is applying AMEX-specific formatting twice. Here's the fix..." Instead of guessing at possibilities, it's debugging actual runtime behavior.
The future: auto-correlation makes AI debugging actually useful
The next generation of debugging doesn’t depend exclusively on the quality of AI models, but it’s heavily dependent on feeding AI tools the context they need to be useful.
Auto-correlation tools like Multiplayer automatically capture and link data across your entire stack: frontend interactions, backend traces and logs, and end-to-end request/response headers and content from internal service and external API calls. This data becomes the foundation for effective AI-assisted debugging.
When AI has access to:
- What the user actually did (not what you think they did)
- What data your system actually sent (not what it should send)
- What external APIs actually returned (not what the docs say they return)
- How your code actually processed the response (not what you intended)
... then AI can shift from suggesting possibilities to diagnosing realities.
This is why auto-correlation and AI coding assistants are complementary, not competing technologies. Correlation tools provide the runtime context that transforms AI from a pattern-matcher into a debugger.
👀 If this is the first time you’ve heard about Multiplayer, you may want to see full stack session recordings in action. You can do that in our free sandbox: sandbox.multiplayer.app
If you’re ready to trial Multiplayer you can start a free plan at any time 👇