Why debugging breaks without visual communication
Communication is usually the hardest part of any software developer’s job, especially when working on distributed systems. We look at why visual collaboration is critical for effective debugging.

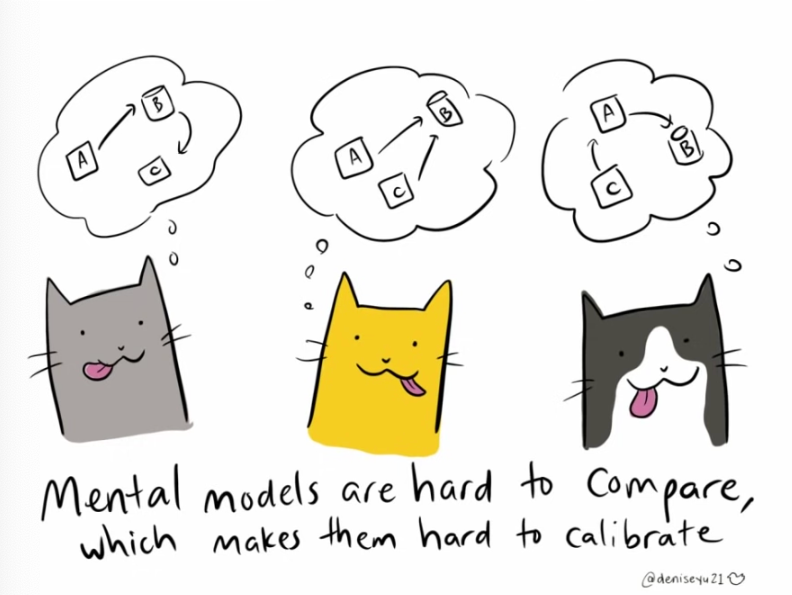
If you tell three people they’ll be having rice for dinner, each one will imagine a different dish: it could be anything from risotto, to paella, to chicken biryani!
Now imagine the results when you ask three engineers (maybe on different teams) to describe the latest production bug. Each will focus on a specific aspect: the frontend, the backend, the back-and-forth with the end-users. Each perspective is valid, but none tells the complete story.
Now imagine trying to debug a distributed system issue across multiple services, teams, and time zones. Without a shared visual understanding of what actually happened, you're not just trying to solve a bug, you're also wrestling with trying to communicate clearly so that everyone shares the same understanding and mental picture of the problem.
The inherent complexity of software teams
In the world of software engineering, the ability to communicate and collaborate effectively is essential to building high-quality products. However, the process of debugging distributed systems can be especially challenging, as it has many levels of complexity:
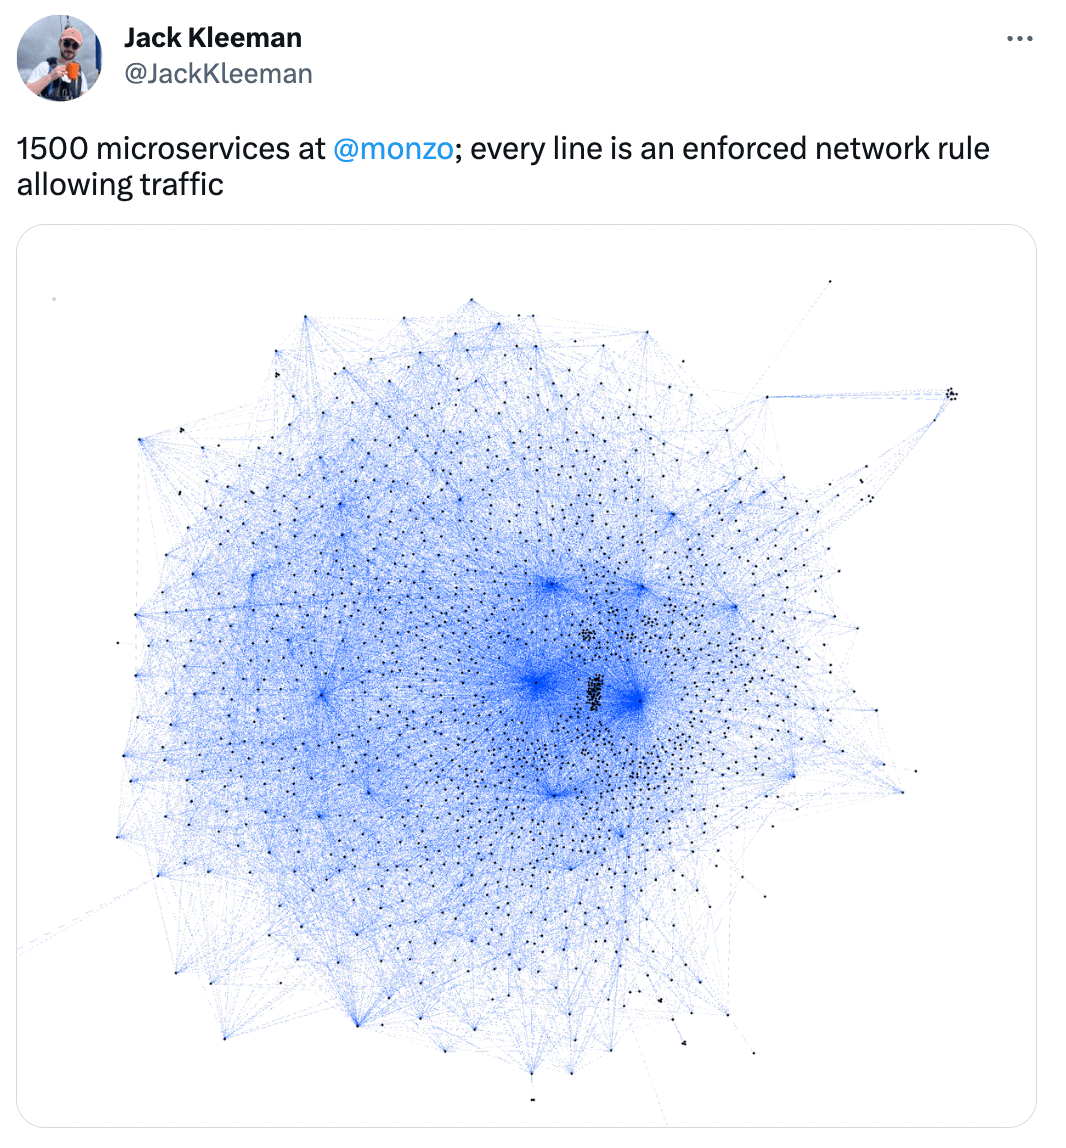
- System complexity keeps growing. The more fault-tolerant and scalable we make our distributed systems, the more inherently complex they become (even Galileo Galilei said so … not in quite those words). What starts as a simple modular monolith evolves into dozens of microservices, message queues, caching layers, and third-party integrations, each adding potential failure points that must be understood and debugged.
- Cross-functional collaboration across boundaries. Modern debugging often requires coordinating multiple teams across offices and time zones, each with specialized knowledge of their domain. The frontend team understands UI state management. The backend team knows the API contracts. The infrastructure team manages the deployment pipeline. The data team owns the analytics stack. Getting all these experts aligned (accounting for their availability, priorities, and communication styles) becomes a logistical challenge that rivals the technical complexity of the bug itself.
- Competing priorities create friction. Support teams are measured on time-to-resolution and want bugs fixed immediately. Product managers need new features shipped to meet roadmap commitments. Engineers want to refactor technical debt and build maintainable systems. Customers expect both zero downtime and constant innovation. When a critical bug emerges, these competing priorities turn debugging into a negotiation exercise: Who investigates? How deeply? What else gets delayed? Each stakeholder views the same issue through a different lens of urgency and importance.
The limitations of verbal and written communication
“As the complexity of a system increases, the accuracy of any single agent’s own model of that system decreases rapidly”
- Dr. David Woods, “Coping with complexity: the psychology of human behavior in complex systems”
Humans are visual by nature. After all, there's a reason most cultures have a variation of the expression "a picture is worth a thousand words". Very few people enjoy attending hours-long meetings or reading wall-of-text emails, dense Slack threads, or paragraph-heavy documentation. We need visual aids to align our mental models and convey meaning clearly.
This need is also mirrored in the explosion of visual collaboration tools like Miro, Figma, and Lucidchart. Research by Gartner shows collaboration tool usage increased 44% among digital workers since 2019. Design software became the third fastest-growing category in 2022, with 31% year-over-year growth.
But here's the challenge: even with visual aids, everyone constructs a slightly different mental model based on their own frames of reference, priorities, and experience. And when it comes to debugging, those differences become critical.
Consider describing this bug in a Slack message or Jira ticket:
The checkout flow failed for a user after they applied a discount code. We're seeing 500 errors in the logs around 2:47 PM.Each reader immediately constructs a different mental image: the frontend developer pictures UI state issues. The backend developer assumes database timeouts. The infrastructure team wonders about load balancer configuration. Everyone is working from a different mental model of what "failed" means.
In addition to this tendency of creating slightly different mental models, we also have the universal limitations of human memory to contend with. We like to imagine that our brains stack knowledge neatly, like building with Lego blocks: one piece of information layered carefully on top of another to create a complete picture of the problem.
The reality is far messier: we're juggling those Lego blocks, desperately trying to keep hold of the most relevant pieces while hoping we don't forget the rest. And in a distributed system with dozens (or hundreds?) of microservices, dependencies, API contracts, data flows, and integration points, keeping everything in mind simultaneously is simply impossible.
In short, the cognitive load of mentally assembling all these pieces (while keeping track of timestamps, user context, and system state) is simply too high for accurate verbal or text communication.
Without visual aids to complement our communication, we're always at risk of misunderstandings. And misunderstandings mean more meetings, more back-and-forth, and more time wasted before anyone can actually start fixing the problem.
The hidden cost of debugging workflows
Our software is more and more complex, communicating across different stakeholders is sometimes a coordination nightmare, verbal and text communication has built-in limitations ... and to add to that, debugging workflows often follow the same frustrating pattern:
- User reports an issue (often vaguely described)
- Support gathers more information through back-and-forth messages
- Engineering reviews logs, traces, and metrics across multiple tools
- Team schedules an "alignment call" to piece together what happened
- Someone draws diagrams on a whiteboard to visualize the flow of data across multiple services
- More investigation reveals missing pieces
- Repeat steps 2-4 until the issue is understood
This process can take days even when a bug is not difficult to fix. The actual resolution (changing a few lines of code, adjusting a configuration, rolling back a deployment) might take minutes.
Teams spend 80% of their time just figuring out what happened and aligning on it. Meanwhile, customers remain frustrated, support tickets pile up, and engineers who should be building new features are instead stuck in meeting after meeting trying to reconstruct the problem.
What visual debugging requires
Adding a visual component to debugging workflows is much more than just including a manually captured screenshot or a video to your Jira ticket. It requires:
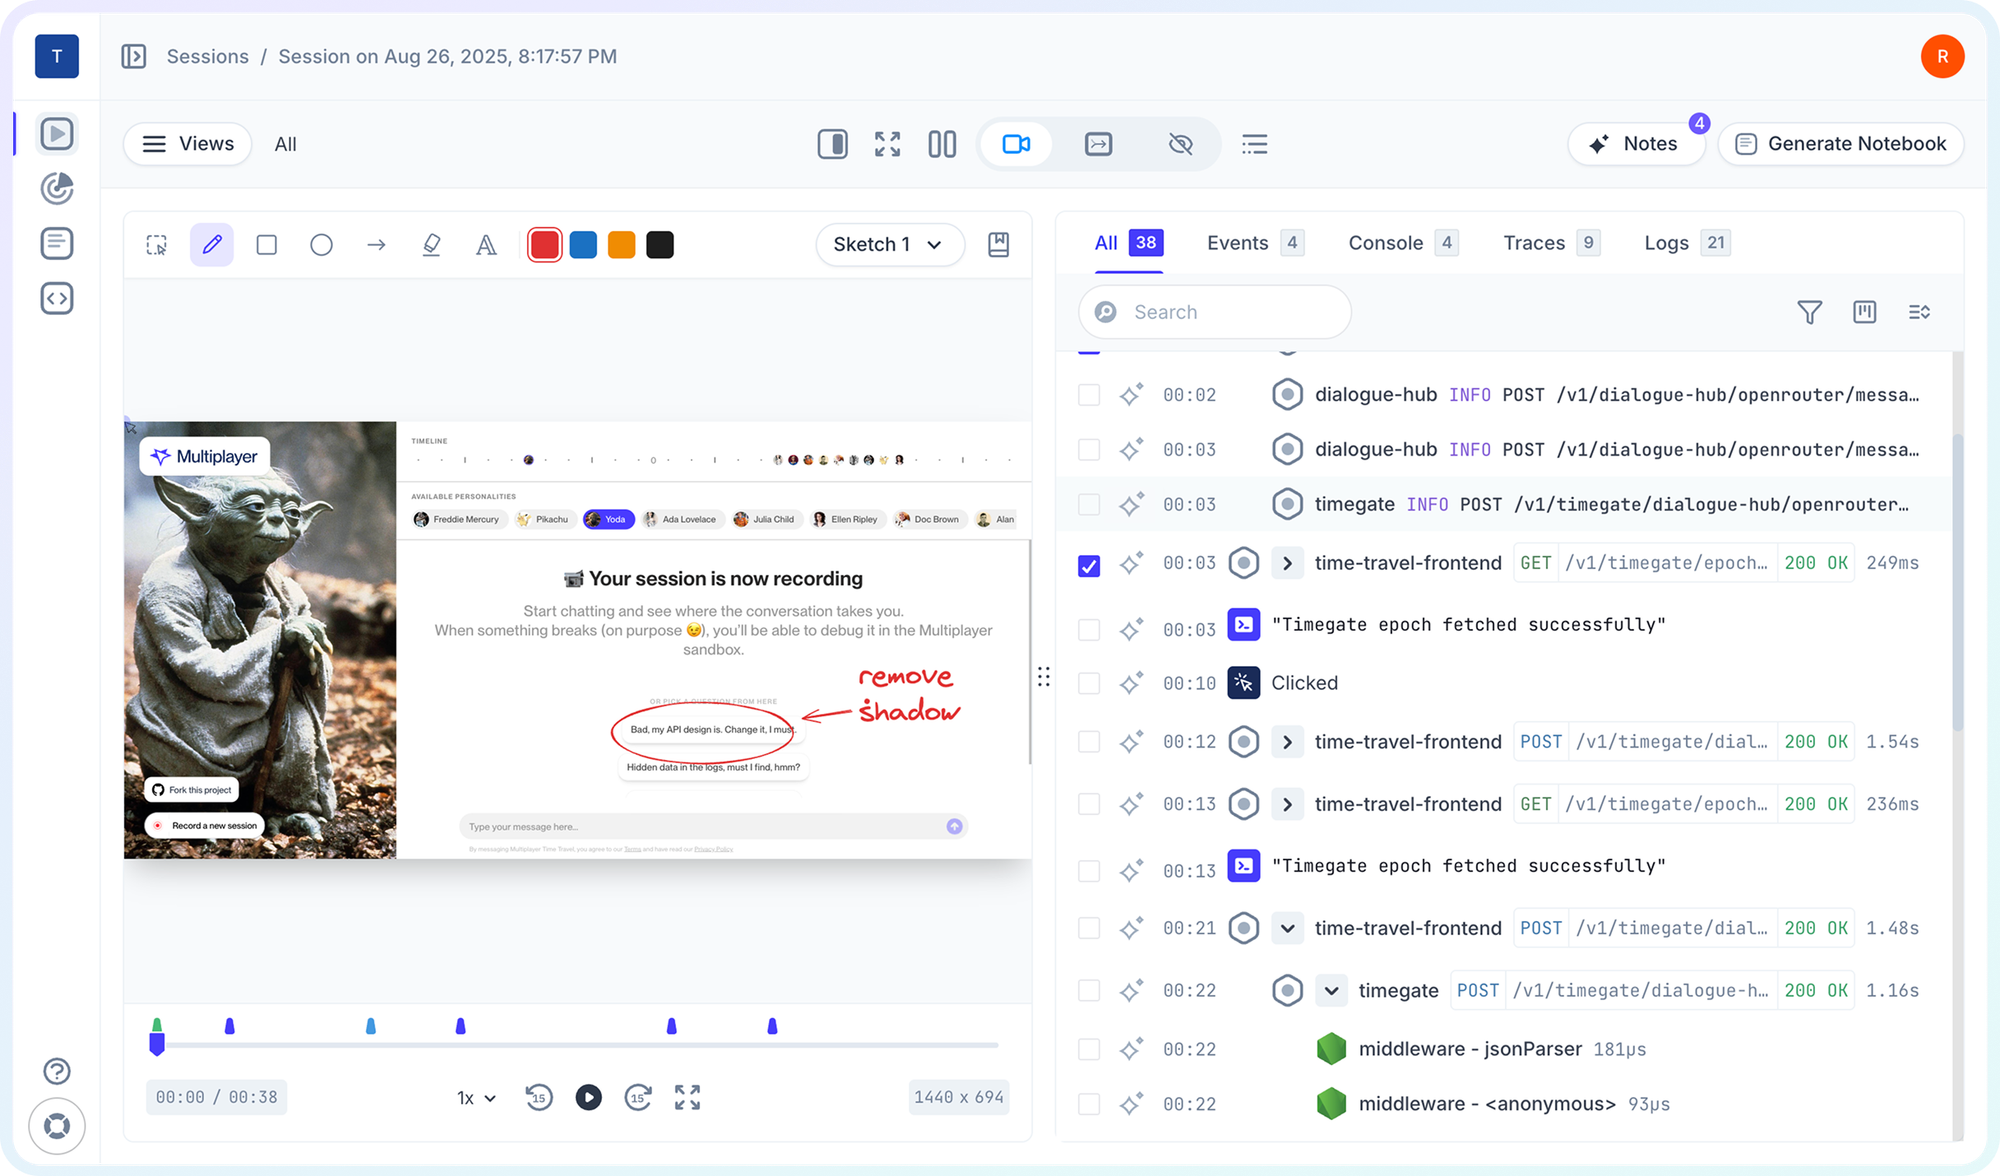
- Automatic capture of the issue. A visual representation generated from the actual system behavior. When a user reports an issue, you should see exactly what they saw and did, synchronized with exactly what your systems did in response.
- End-to-end technical context. User actions, UI state, network requests, backend traces, logs, errors, etc. all on a single timeline. Not scattered across APM tools, log aggregators, error trackers, and support tickets.
- Collaborative annotation. The ability for multiple team members to review the same visual representation and add context, questions, or insights inline. Support can annotate what the user reported, frontend engineers can highlight UI behavior, backend engineers can trace system calls.
- Integration with existing workflows. Visual debugging information that flows directly into your existing tools (Zendesk, Intercom, Slack, Jira, Linear, GitHub) rather than requiring everyone to context-switch to yet another platform.
- AI-friendly data structure. Modern debugging increasingly involves AI assistants. Visual information needs to be captured in a structured format that both humans and AI tools can parse, analyze, and reason about.
The path forward
The future of debugging isn't just about better logs or more sophisticated tracing. It's about visual communication that automatically captures and presents the complete context of what happened.
Imagine this debugging flow instead:
- User reports an issue with a session recording link
- Engineering opens the recording and sees the entire user journey synchronized with system traces
- Team discusses in Slack with the recording embedded, everyone looking at the same visual timeline
- AI coding assistant analyzes the session data and suggests root cause
- Issue is understood and resolved in hours
Debugging complex systems will always be challenging to some degree. But it doesn't have to be a communication nightmare.
The question isn't whether visual information matters for debugging. Every every screen-sharing call proves that it does.
The question is whether we'll continue manually reconstructing all the context instead of using a visual representation that accurately shows what happened and enables focused technical problem-solving.
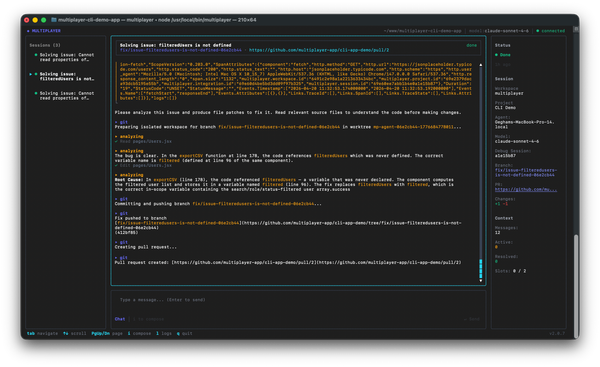
One copy/paste in your terminal and the debugging agent is running:
npm install -g @multiplayer-app/cli && multiplayer
Rather explore first?👇