Can AI solve two of the biggest problems in distributed systems: documentation and debugging?
Documenting and debugging distributed systems is still one of the most painful reality of engineering teams. Can AI tools help with that and what are their limits?

AI is everywhere. Depending on who you ask, it’s either making developers obsolete, or it’s just hype. But for those of us who’ve actually used AI tools in real-world engineering workflows, especially in complex distributed systems, the truth lies somewhere in between.
At Multiplayer, we’ve spent the past few years exploring how AI can, and can’t, help solve two of the most persistent challenges in distributed systems: documentation and debugging.
This post captures our biggest lessons, pain points, and what we’ve learned about building AI-powered tools that actually work for engineers.
Why documentation and debugging still hurt
I’ve worked in distributed systems for decades, across Citrix, startups, and scaleups. And the two pain points that have followed me at every stage? Documentation and debugging.
Let’s start with documentation. And I don’t mean code comments. I mean the entire constellation of architectural knowledge: API specs, design decisions, integration guides, tribal knowledge buried in Confluence pages or Slack threads. And yes, the infamous whiteboard snapshot titled “final system diagram.”
Over the years, I’ve seen every well-meaning attempt to keep documentation up to date:
- Embedding tech writers into the team (who ended up chasing engineers on Slack)
- Adding “write docs” as a sprint task (a permanent resident of the backlog)
- Rotating documentation duties (which led to sync meetings where no one knew the full picture)
The truth is: We’re trying to document living, evolving systems with static tools. It doesn’t scale. It doesn’t stay accurate. And it definitely doesn’t help during production incidents.

My experiences with debugging are equally painful, and it’s deeply connected with documentation. Because when docs are out of date (or just missing), understanding the system becomes an archaeological dig.
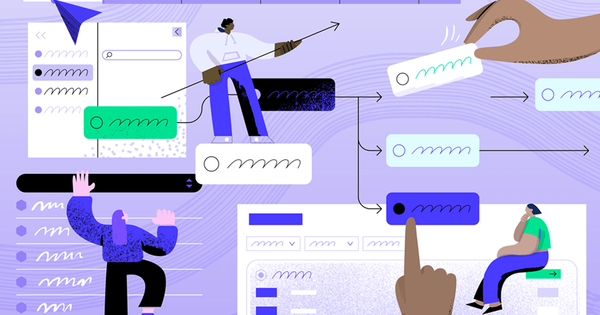
But debugging adds its own special flavor of chaos:
- You're handed a vague bug report with zero reproduction steps.
- You waste hours grepping through logs files or in back-and-forth with internal teams and end-users to find all the information you need
- You open six tabs and continuously have to switch between them: one for screen recordings, one for logs, one for traces, one for dependencies, and three more just because you’re hoping they might have something useful.
And all this, just to understand the problem, before you’ve even started to fix it.
These are not a fringe problems. They are daily ones. Across every team, at every stage of growth.
And the cost isn’t just time. It’s also confidence. Engineers grow afraid to touch parts of the system. Knowledge gets siloed. Tech debt quietly builds.
Where current AI tools fall short
The promise of AI-powered debugging and documentation tools is compelling: intelligent code analysis, automated root cause suggestions, natural language explanations of complex system behavior. And in isolated scenarios, they deliver.
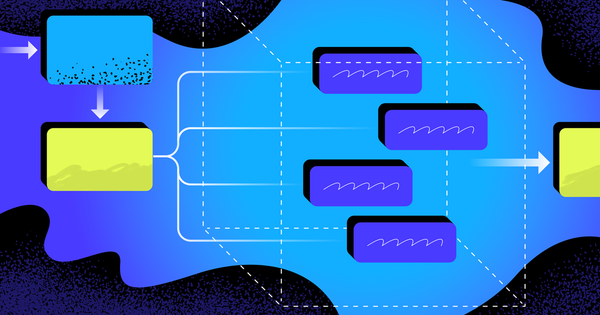
But in distributed systems, the fundamental limitation is context. Most AI tools are effective at structured, repetitive tasks with clear inputs and outputs, but struggle when faced with ambiguous situations or not enough data. When you ask an AI assistant to explain why an issue occurred across multiple microservices, it can only work with what you give it: the issue description copied from a user report, the specific log snippet you paste, the trace ID you provide, the code file you have open.
However, when context gets lost at service boundaries, or you have to manually stitching information together across conversations, browser tabs, and multiple tools (session replay, error monitoring, APM, support ticket, etc.), the problem compounds quickly.
Research shows that between one-third and two-thirds of AI-generated code contained errors requiring manual correction, not because the AI produces syntactically incorrect code, but because it lacks the context to generate code that actually works with existing systems.
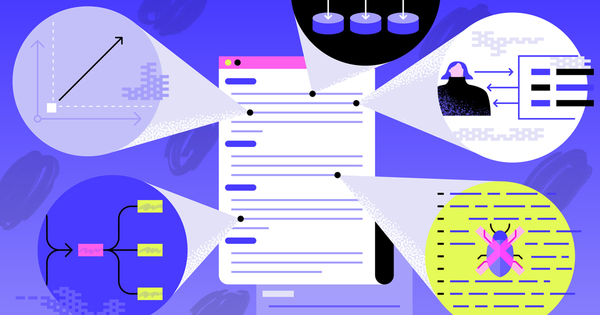
Even the most sophisticated AI debugging assistants today operate with partial visibility. They can analyze stack traces brilliantly, if you give them the right stack trace. They can explain error patterns, if you've already found the relevant logs. They can suggest fixes, if you've accurately described the full stack architecture.
The quality of AI output is directly tied to the quality of the input, and AI cannot invent missing context. The knowledge that humans would need to correctly diagnose an issue (the full lifecycle of a user action from click to all the services the request touched) is exactly what AI tools need too. Without it, they're guessing.
Multiplayer's approach: full stack visibility first, AI second
Multiplayer took a different path: solve the visibility problem first, then layer AI on top.
Full stack session recordings include all the relevant data needed to find and fix a bug, from frontend screens and user actions to backend distributed traces, logs, request/response content and headers.
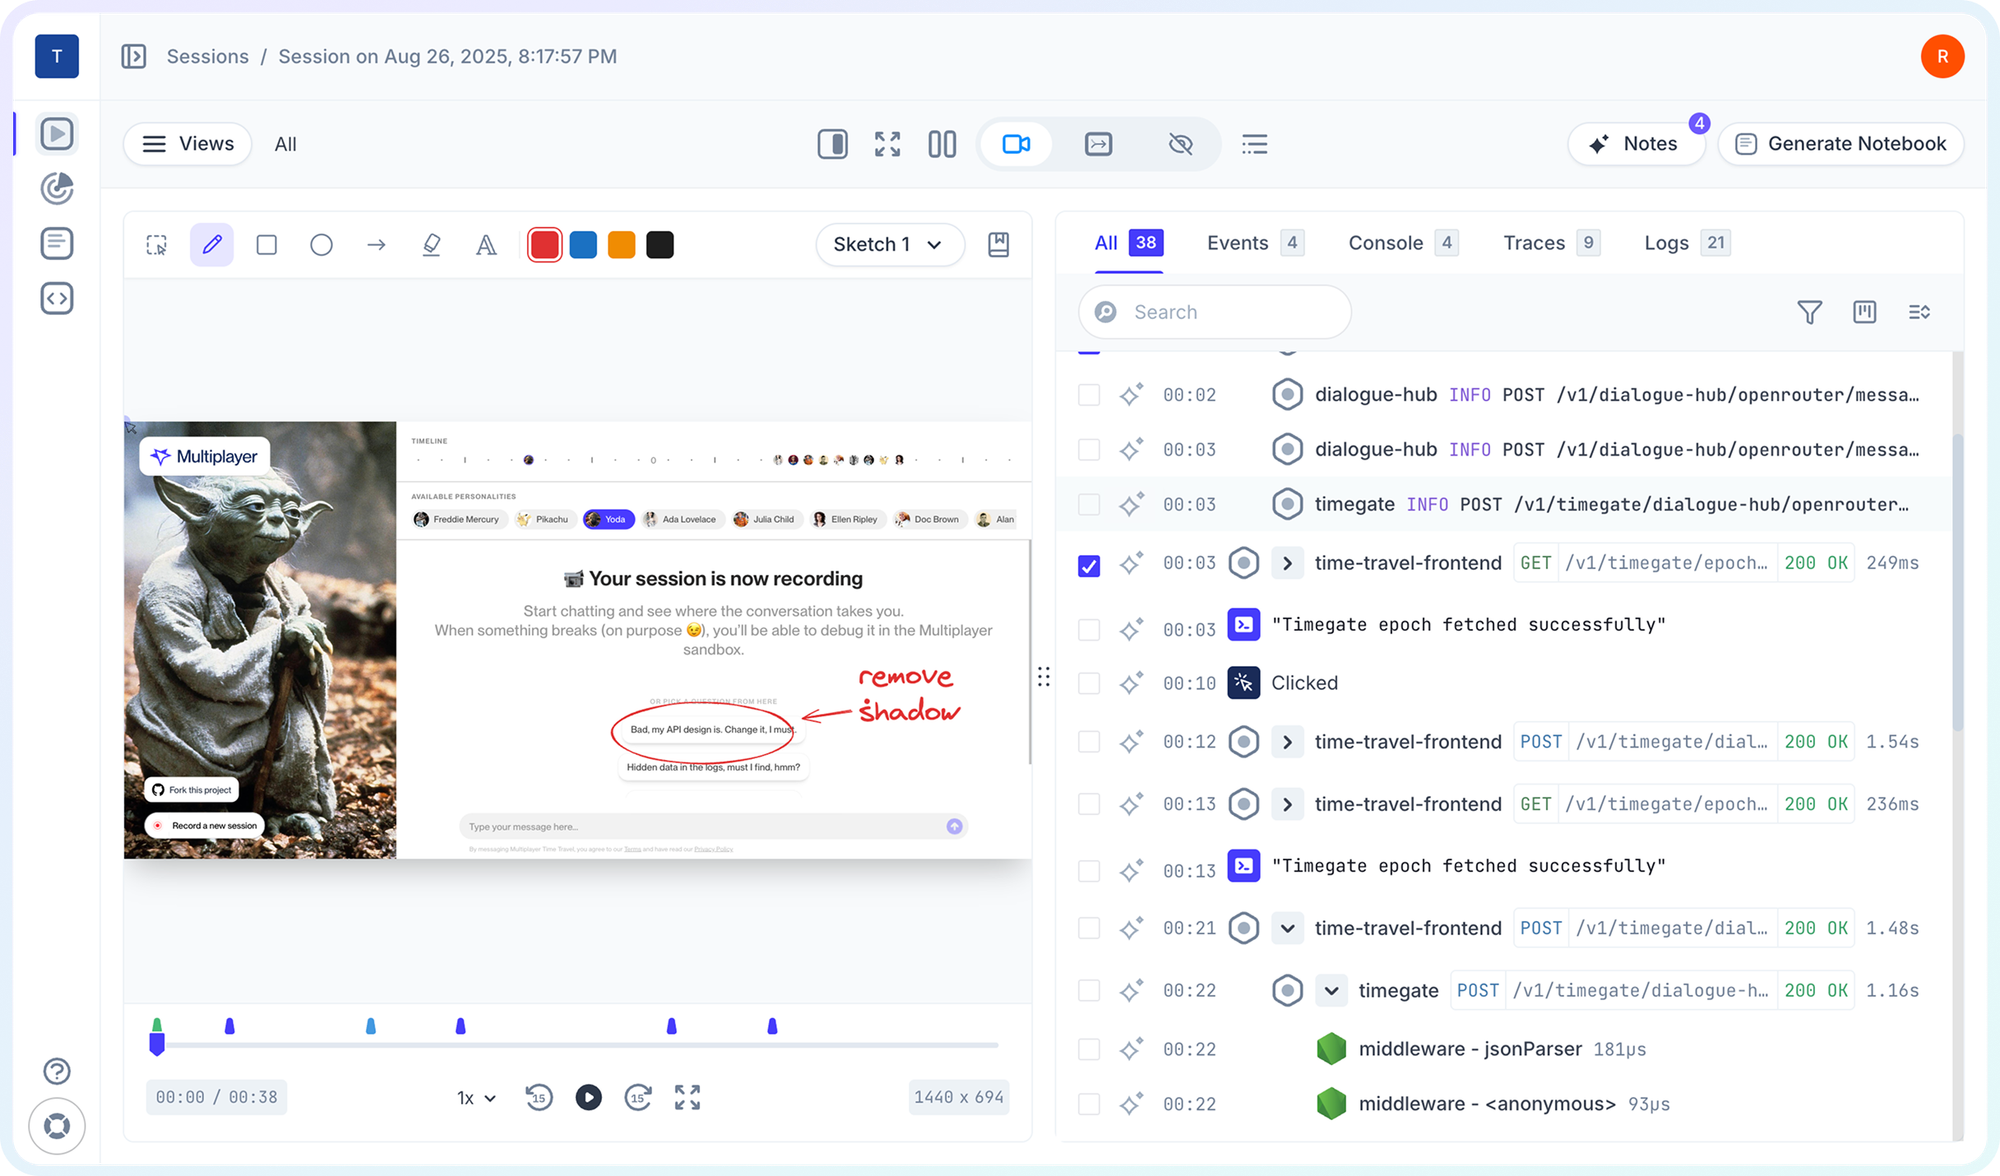
Any given session shows you exactly how an issue happened across all the layers of your system. The user's click, the API request it triggered, every service that request touched, the database queries that were executed, the response that came back, and how the frontend rendered it.
This is fundamentally different from traditional debugging tools. Instead of manually reproducing issues and hunting for relevant data within myriad logs, metrics and traces, Multiplayer captures the steps to reproduce an issue along with relevant backend data, all in one click.
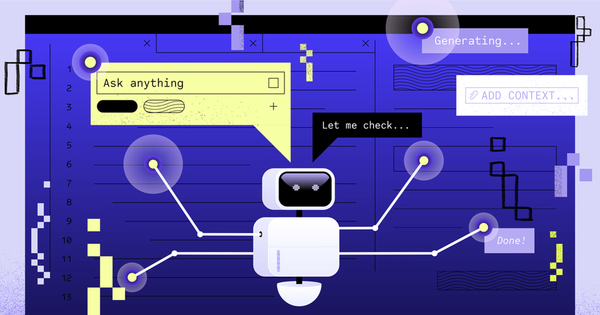
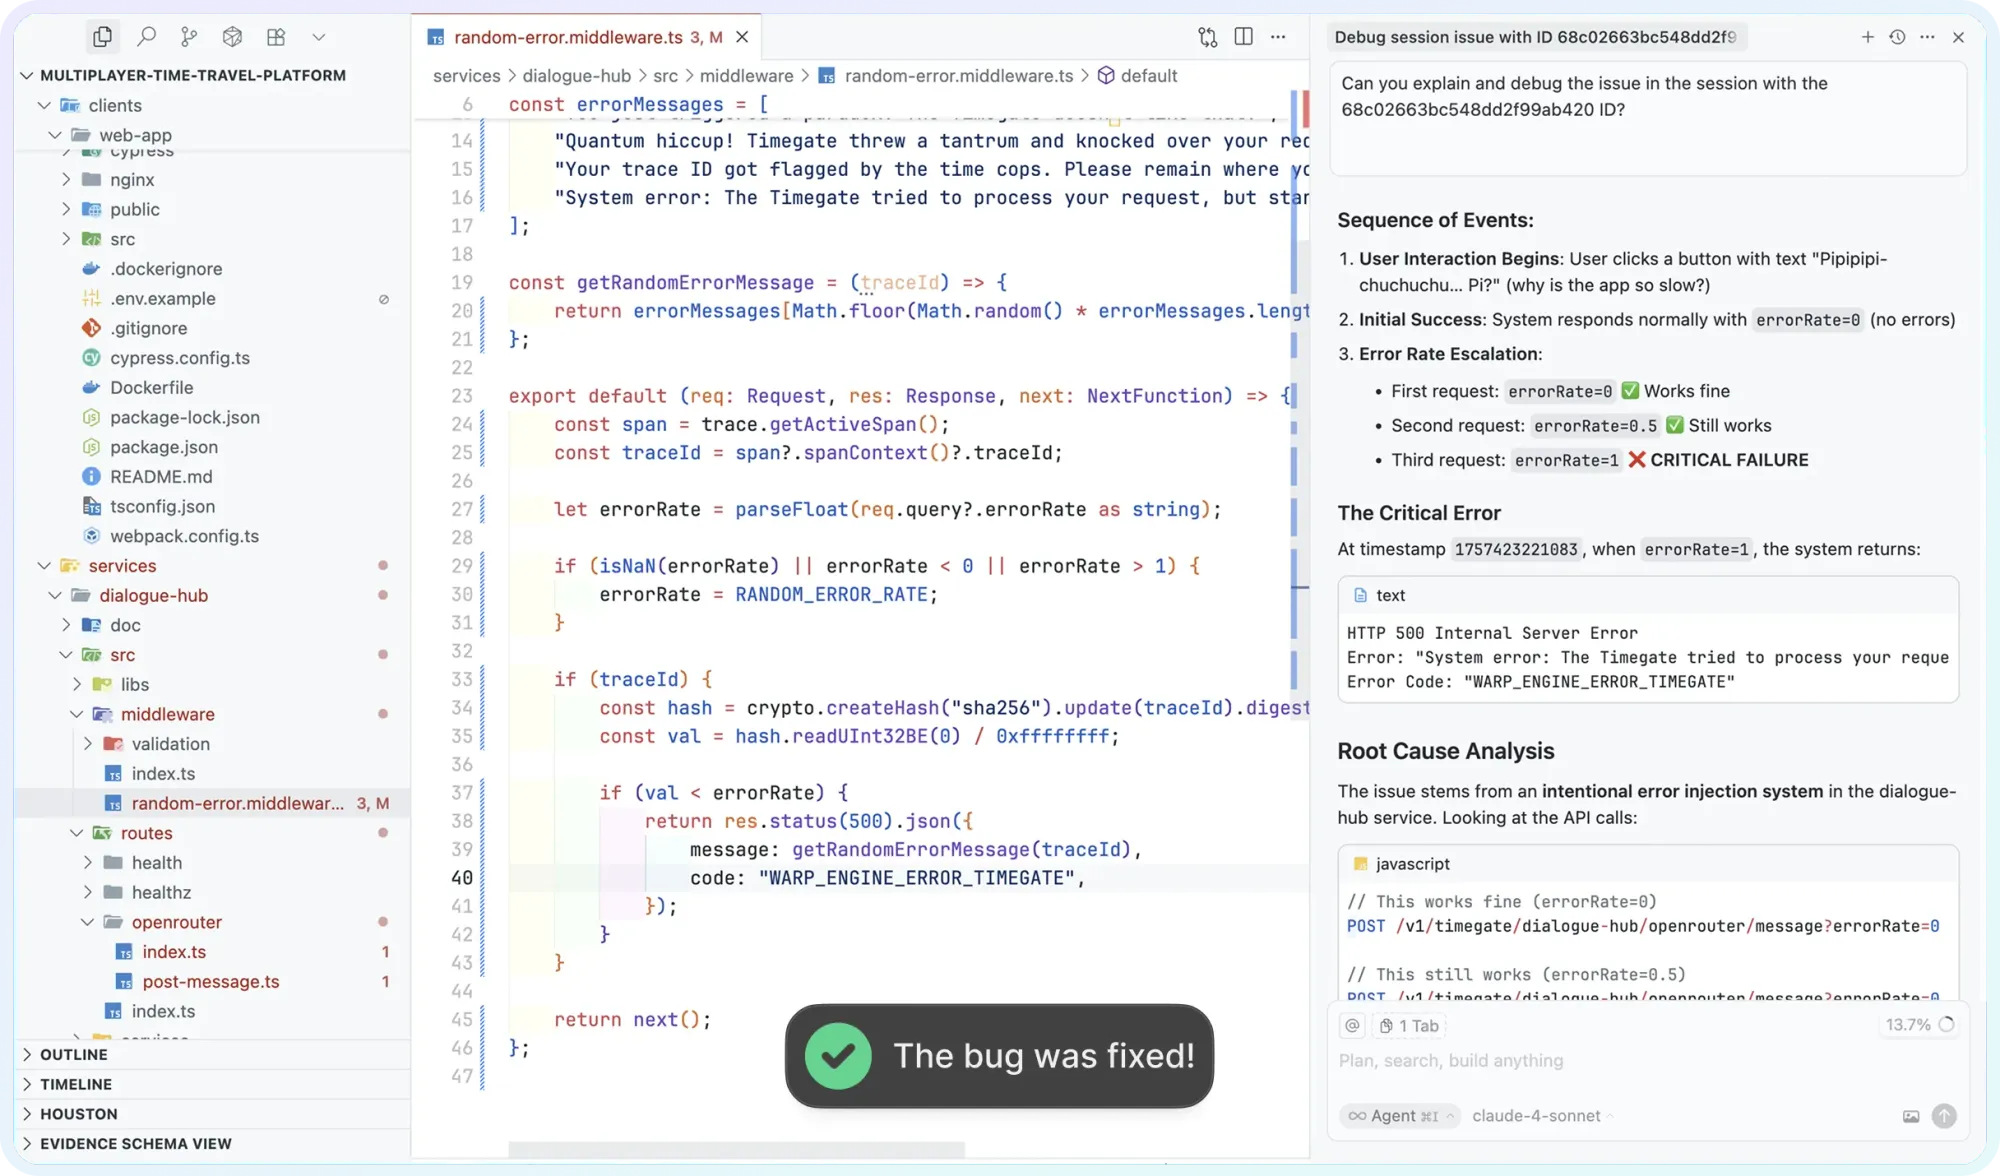
Here's why this matters for AI: Multiplayer features native support for VS Code Extension and the MCP server, so it can bring full-stack session recordings directly to your IDE and AI assistants, meaning they can be armed with complete context to reason, suggest fixes, or automate repetitive tasks.
When you feed a session recording to Claude or Cursor through Multiplayer's MCP server, you're showing the AI exactly what happened. The AI can see the frontend interaction, trace through the backend services, inspect the actual request and response bodies, and review and sketches or comments your team might have left on the recording.
This approach of relying on your live system as the source of truth extends to documentation too. Multiplayer's system dashboard provides a dynamic, always up-to-date view of your entire system architecture, including components, dependencies, APIs, and more. The system continuously discovers and documents components, dependencies, and APIs, ensuring your system is always accurate and up-to-date.
This isn't documentation as a one-time deliverable. It's documentation as a living capability, automatically maintained from the same telemetry that powers the debugging experience.
The result is faster debugging workflows. You're no longer constrained by what you remember to tell your AI tools or which tabs you have open. Your tools already have access to the complete narrative of system behavior. The kind of context that turns AI from a helpful assistant into a genuinely powerful debugging partner.
You're still doing the engineering work. You're still making the decisions. But you're no longer playing detective, manually correlating logs and traces and user reports. The system has already done that work. And the AI can help you understand what it means.
👀 If this is the first time you’ve heard about Multiplayer, you may want to see full stack session recordings in action. You can do that in our free sandbox: sandbox.multiplayer.app
If you’re ready to trial Multiplayer you can start a free plan at any time 👇