The four kinds of software architecture diagramming tools
With so many architecture diagramming tools available, choosing the right one depends on why you need the diagram in the first place. Understanding the different categories of diagramming tools can help you pick the right one for your workflow.


Software architecture diagrams are essential for communicating complexity. A well-structured diagram helps engineering teams visualize system design, align on technical decisions, and plan future development while proactively identifying potential issues.
With so many architecture diagramming tools available, choosing the right one depends on why you need the diagram in the first place.
For example, if you're brainstorming a new feature or discussing ideas in a meeting, a drag-and-drop whiteboarding tool might be the quickest and most flexible option.
If you need accurate, up-to-date architecture documentation that evolves with your system, an auto-documentation tool is the better choice.
Understanding the different categories of diagramming tools, and their trade-offs, can help you pick the right one for your workflow. In this post, I'll break down the four main types of software architecture diagramming tools and when to use them.
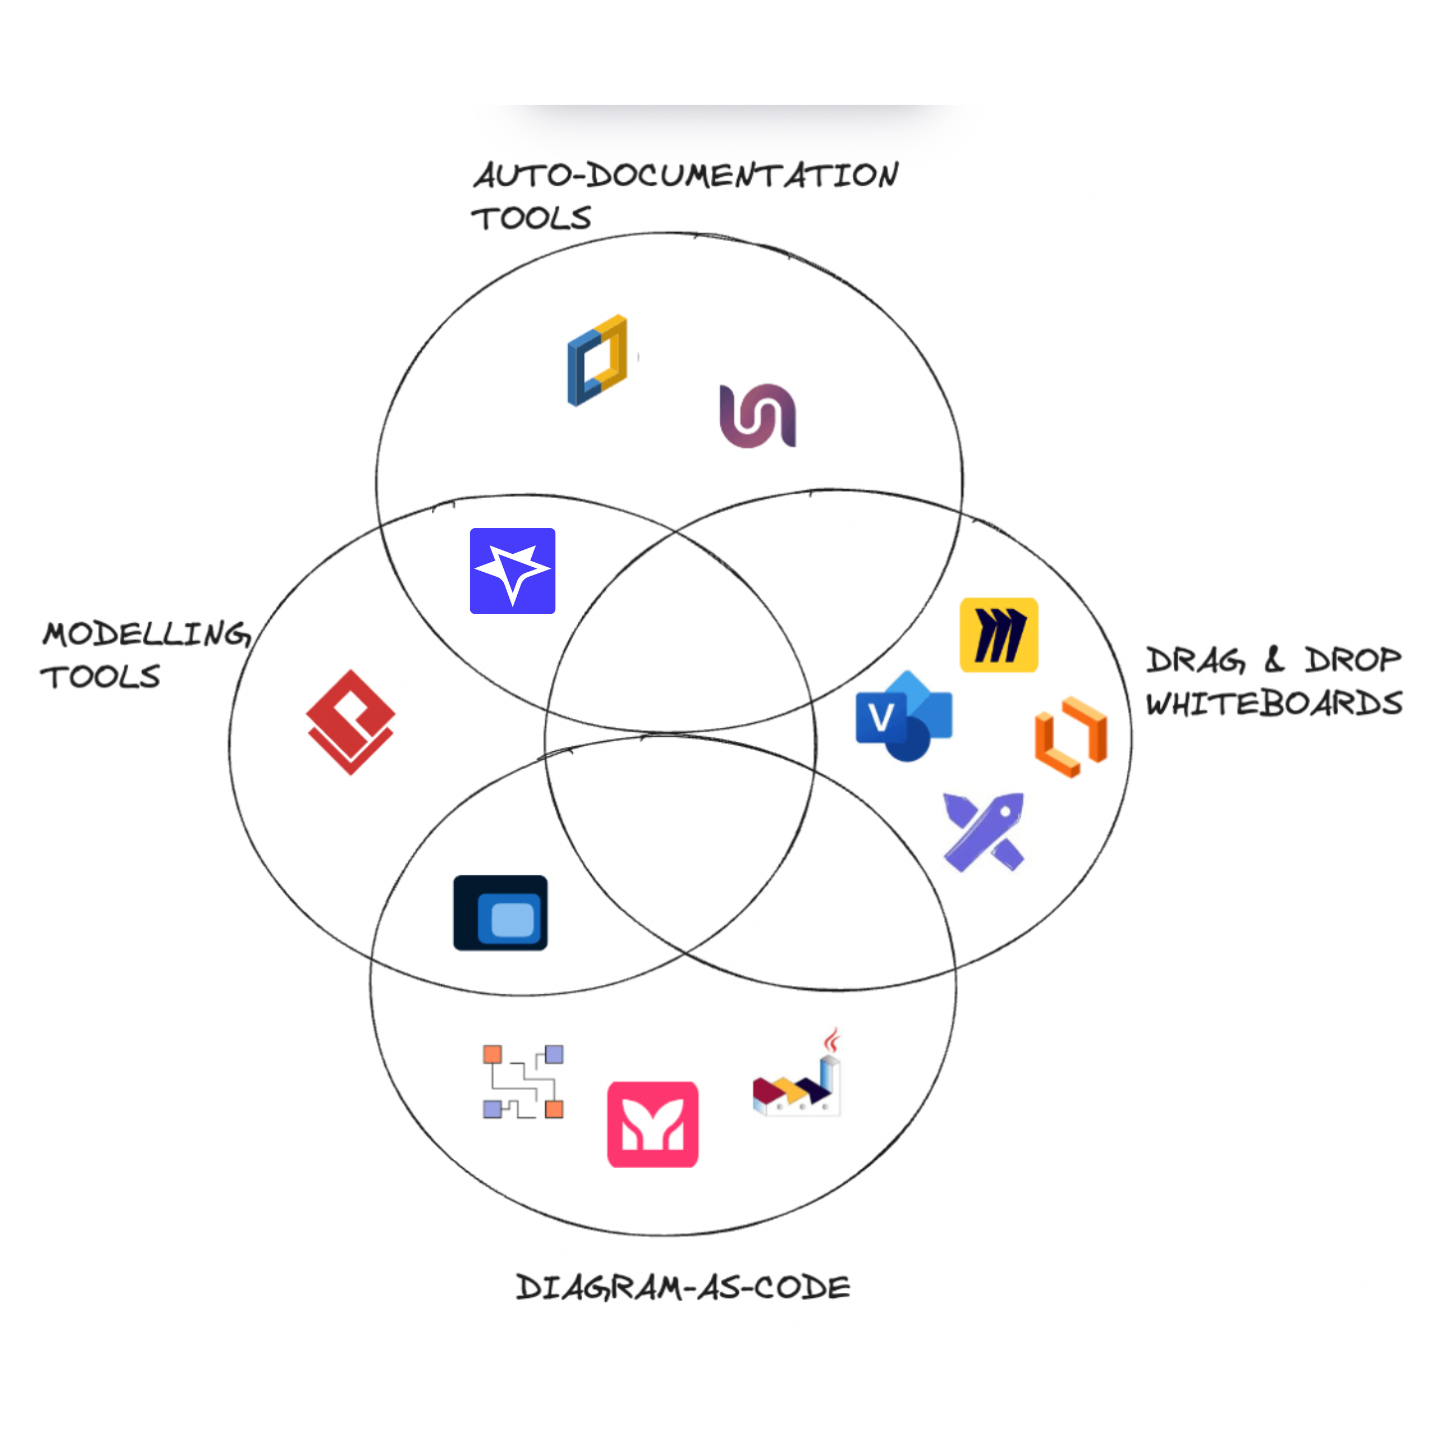
It’s an ever-changing venn diagram
The most common way to categorize software architecture diagramming tools is by how they visualize system architecture:
- Drag-and-drop whiteboards
- Modeling tools
- Diagram-as-code tools
- Auto-documentation tools
But this classification is imperfect because:
- These tools are designed for different use cases and have developed specialized features for their particular audience.
- Many tools overlap across categories, offering functionalities from multiple approaches.
- The tooling landscape is constantly evolving, as products fine-tune their positioning and expand their feature sets.
Take Miro, for example: it’s a general-purpose drag and drop whiteboarding tool used for everything from product roadmaps to vision boards. Not a tool designed specifically for software architecture. As a result, it prioritizes versatility and real-time collaboration over system architecture-specific features. Categorizing it by how teams use it (i.e., creating static snapshots of a system) rather than how the diagram is generated (i.e., dragging and dropping elements) might be more meaningful.
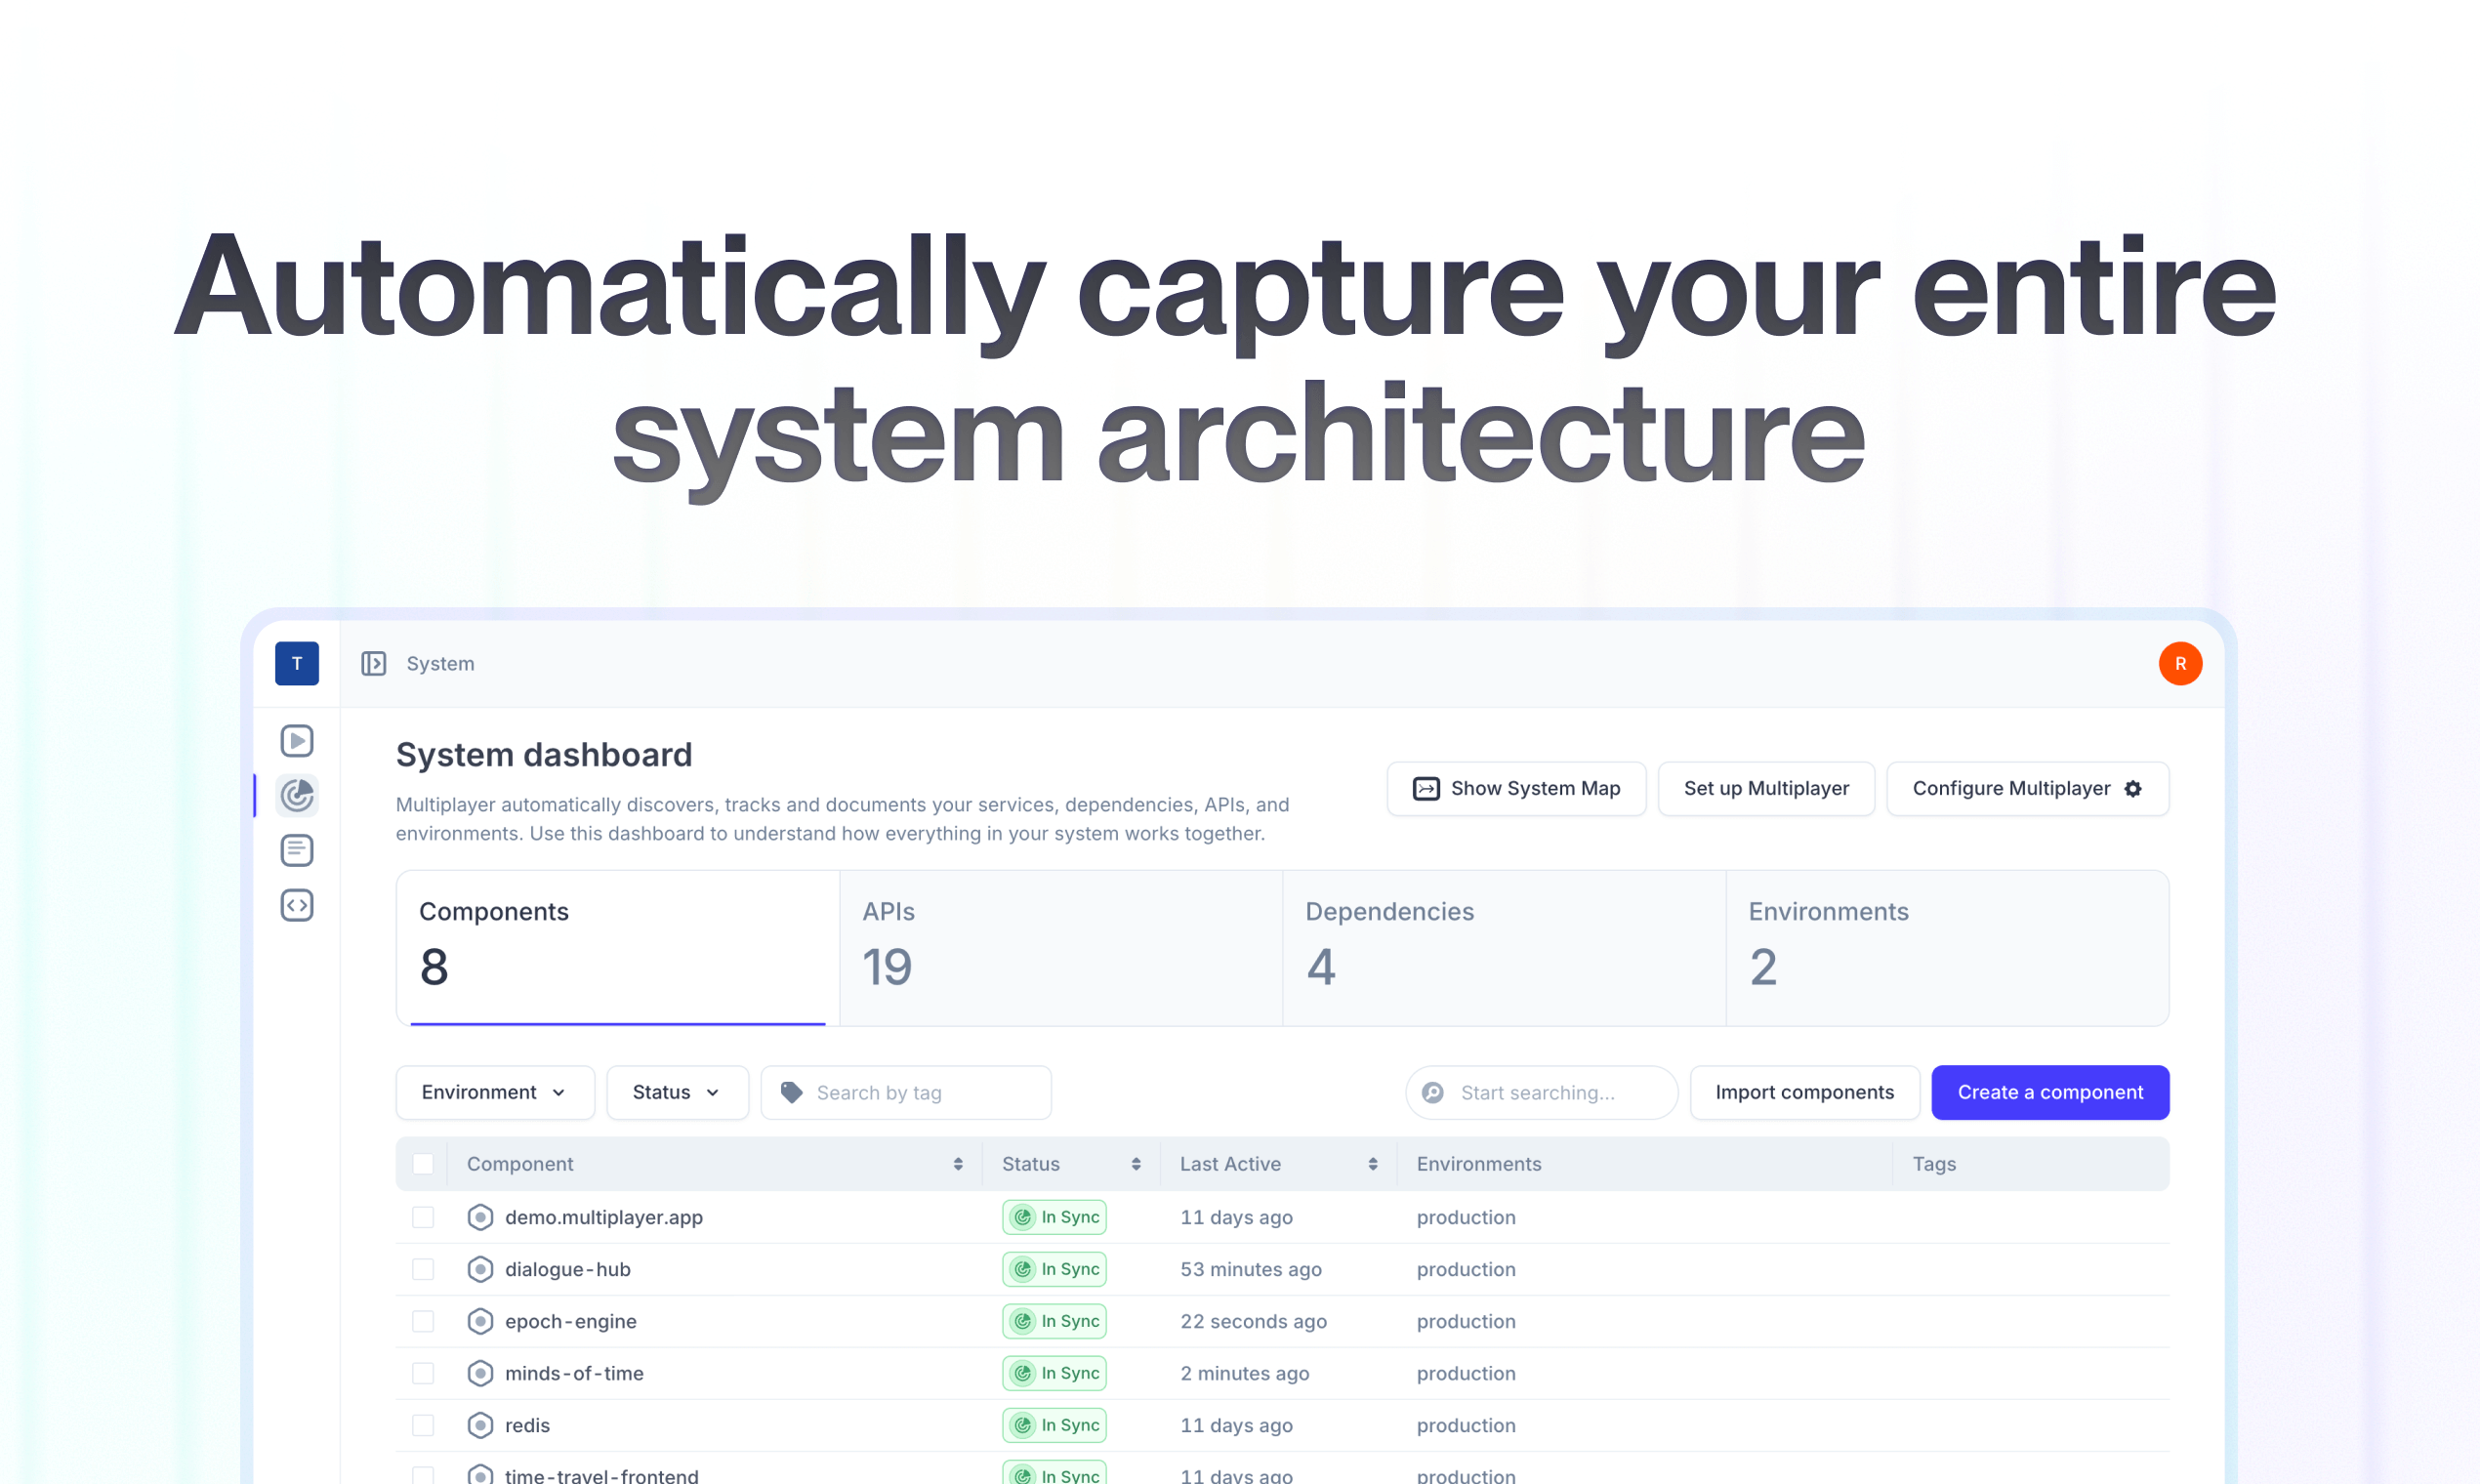
Another example is Multiplayer. We use OpenTelemetry to auto-document your system architecture and provide real-time, full-stack visibility into your system. The objective is to aid support and engineering teams in achieving an immediate and accurate understanding of their system so that they can debug technical issues faster.
So, while the following Venn diagram and categorization offer a useful snapshot of today’s landscape, remember, it’s just that: a snapshot. Just like drag-and-drop whiteboards create a static representation of your system, these classifications are temporary, and the tools themselves will continue to evolve. 😉
Four types of diagramming tools
Software architecture diagrams serve different purposes depending on the SDLC (Software Development Life Cycle) stage, debugging workflows, and documentation needs. While all tools aim to visualize your system architecture, they differ in how diagrams are created, maintained, and updated over time.
Here are the four main categories of diagramming tools:
Drag-and-drop whiteboards
Drag-and-drop whiteboarding tools provide a freeform, visual canvas for creating diagrams quickly, without requiring technical validation. They are ideal for brainstorming, exploratory design, and collaborative planning.
These tools focus on flexibility rather than accuracy, allowing teams to sketch rough architectures, workflows, or system designs. However, since they lack enforcement of rules and relationships, they are not suitable for long-term documentation or maintaining evolving architectures.
When to use them
- Rapid brainstorming and sketching ideas
- Early-stage system design discussions
- Cross-functional team collaboration (PMs, designers, engineers)
- One-off diagrams that don’t require version control or automation
⚠️ Avoid as a persistent, day-to-day source of truth for system architecture information, as keeping diagrams updated manually requires significant overhead.
Examples:
- Miro
- Visio
- Lucidchart
- Excalidraw
Modelling tools
Modeling tools go beyond simple diagrams by allowing reusable objects, consistent relationships, and multiple levels of abstraction. Instead of each diagram being a static, standalone artifact, modeling tools create a shared architecture model where changes propagate across all diagram views.
This makes them ideal for long-lived system documentation, as updating a single component in the model will automatically update all associated diagrams.
When to use them
- Long-lived software projects that require maintainable architecture documentation
- Teams that need consistent and reusable objects across multiple diagrams
- Enterprise architecture planning and compliance tracking
- Organizations with complex, interdependent systems
⚠️ Requires discipline and effort to maintain structured models, which can be overkill for hobby projects or early-stage startups.
Examples:
- Visual Paradigm
- Structurizr
- Multiplayer
Diagrams-as-code tools
Diagram-as-code tools allow developers to define architecture diagrams using code or markup, making them version-controllable and automatable within the software development lifecycle.
Instead of dragging and dropping elements, developers write their architecture in a structured text format (e.g., YAML, Markdown, or DSLs), which is then rendered into visual diagrams.
These tools integrate well into CI/CD pipelines, but they still require manual updates to stay accurate.
When to use them
- Teams that prefer code-based workflows and want version-controlled architecture diagrams
- Engineering teams practicing Infrastructure-as-Code (IaC)
- Teams needing lightweight, easily generated architecture diagrams
⚠️ These tools are well suited for planned and/ore required system architecture documentation, but not for ad-hoc system visibility, as they don’t auto-update when the system changes. You still have to manually update the code.
Examples:
- PlantUML
- MermaidChart
- Diagrams
Auto-documentation tools
Auto-documentation tools solve one of the biggest challenges in system architecture: keeping diagrams up to date. Instead of relying on manual updates, these tools automatically generate and maintain diagrams based on your live system.
To achieve this end result tools adopt different approaches:
Some (e.g. Hava, Cloudcraft) connect directly to your cloud environments and automatically draw information about your cloud deployment.
Multiplayer adopts a different approach, integrating with OpenTelemetry to map your system architecture in real time, ensuring an always-accurate representation of components, APIs, dependencies, and infrastructure.
When to use them
- Engineering teams managing distributed systems, microservices, and cloud-based architectures
- Organizations that struggle with outdated documentation and need real-time architecture visibility
- Developers needing accurate system overviews to support debugging of complex technical issues
- Teams practicing DevOps, CI/CD, and continuous deployment
⚠️ Some tools focus only on infrastructure (e.g., cloud resources), while others are best suited in conjection with specific workflows (e.g. debugging and customer support). Choose based on your needs.
Examples:
- Hava
- Cloudcraft
- Multiplayer

Conclusion
The best software architecture diagramming tool depends on your use case and how often your system changes:
- If you need quick sketches, use drag-and-drop whiteboards.
- If you need structured, reusable diagrams, use modeling tools.
- If you want version-controlled architecture documentation, use diagram-as-code.
- If you need immediate system visibility, use auto-documentation tools.
As software systems become increasingly complex and dynamic, the shift towards automated and real-time architecture documentation is inevitable.
Instead of static snapshots, modern tools are moving towards privileging real-time system visibility, ensuring that you have the information you need, when you need it.
👀 If this is the first time you’ve heard about Multiplayer, you may want to see full stack session recordings in action. You can do that in our free sandbox: sandbox.multiplayer.app
If you’re ready to trial Multiplayer you can start a free plan at any time 👇