No more whiteboards: Multiplayer auto-generates architecture diagrams
Multiplayer just made system architecture diagrams effortless—with auto-generated diagrams, CSV imports, and smart layouts. Say goodbye to whiteboards and hello to real-time, accurate visibility.

If you’ve ever wasted hours dragging boxes around in Lucidchart or updating outdated diagram images in Confluence, we hear you.
Visualizing your system shouldn’t feel like a second job.
No matter which type of diagramming tool you prefer (whether it's a drag-and-drop whiteboard, diagram-as-code, or a modeling tool) there’s broad agreement that for any system diagram to be useful to a developer, it needs to meet at least three basic criteria:
✅ Thoroughness
It should represent all the key elements of your system: components, dependencies, APIs, but also critical context like feature requirements and design decisions. A complete system overview lets engineers understand how the system works, verify whether it still meets business needs, and evolve it with confidence. Whether that means building on top of it, refactoring, or rearchitecting it.
✅ Accuracy
A diagram is only useful if it reflects your system’s current reality. Your system is constantly changing and its visual representation should keep up. A useful diagram should be a living source of truth, trusted by anyone on your team without having to worry that it’s outdated, incomplete, or some knowledge is walking out the door with a departing team member.
✅ Automation
No one wants to schedule another meeting just to update a static diagram or spend hours arranging boxes and arrows. The ultimate purpose of diagrams is to provide information. Therefore, the most valuable diagrams are the ones you don’t have to worry about updating: they are automatically generated and updated from real system data.
Focus on automating architecture diagrams
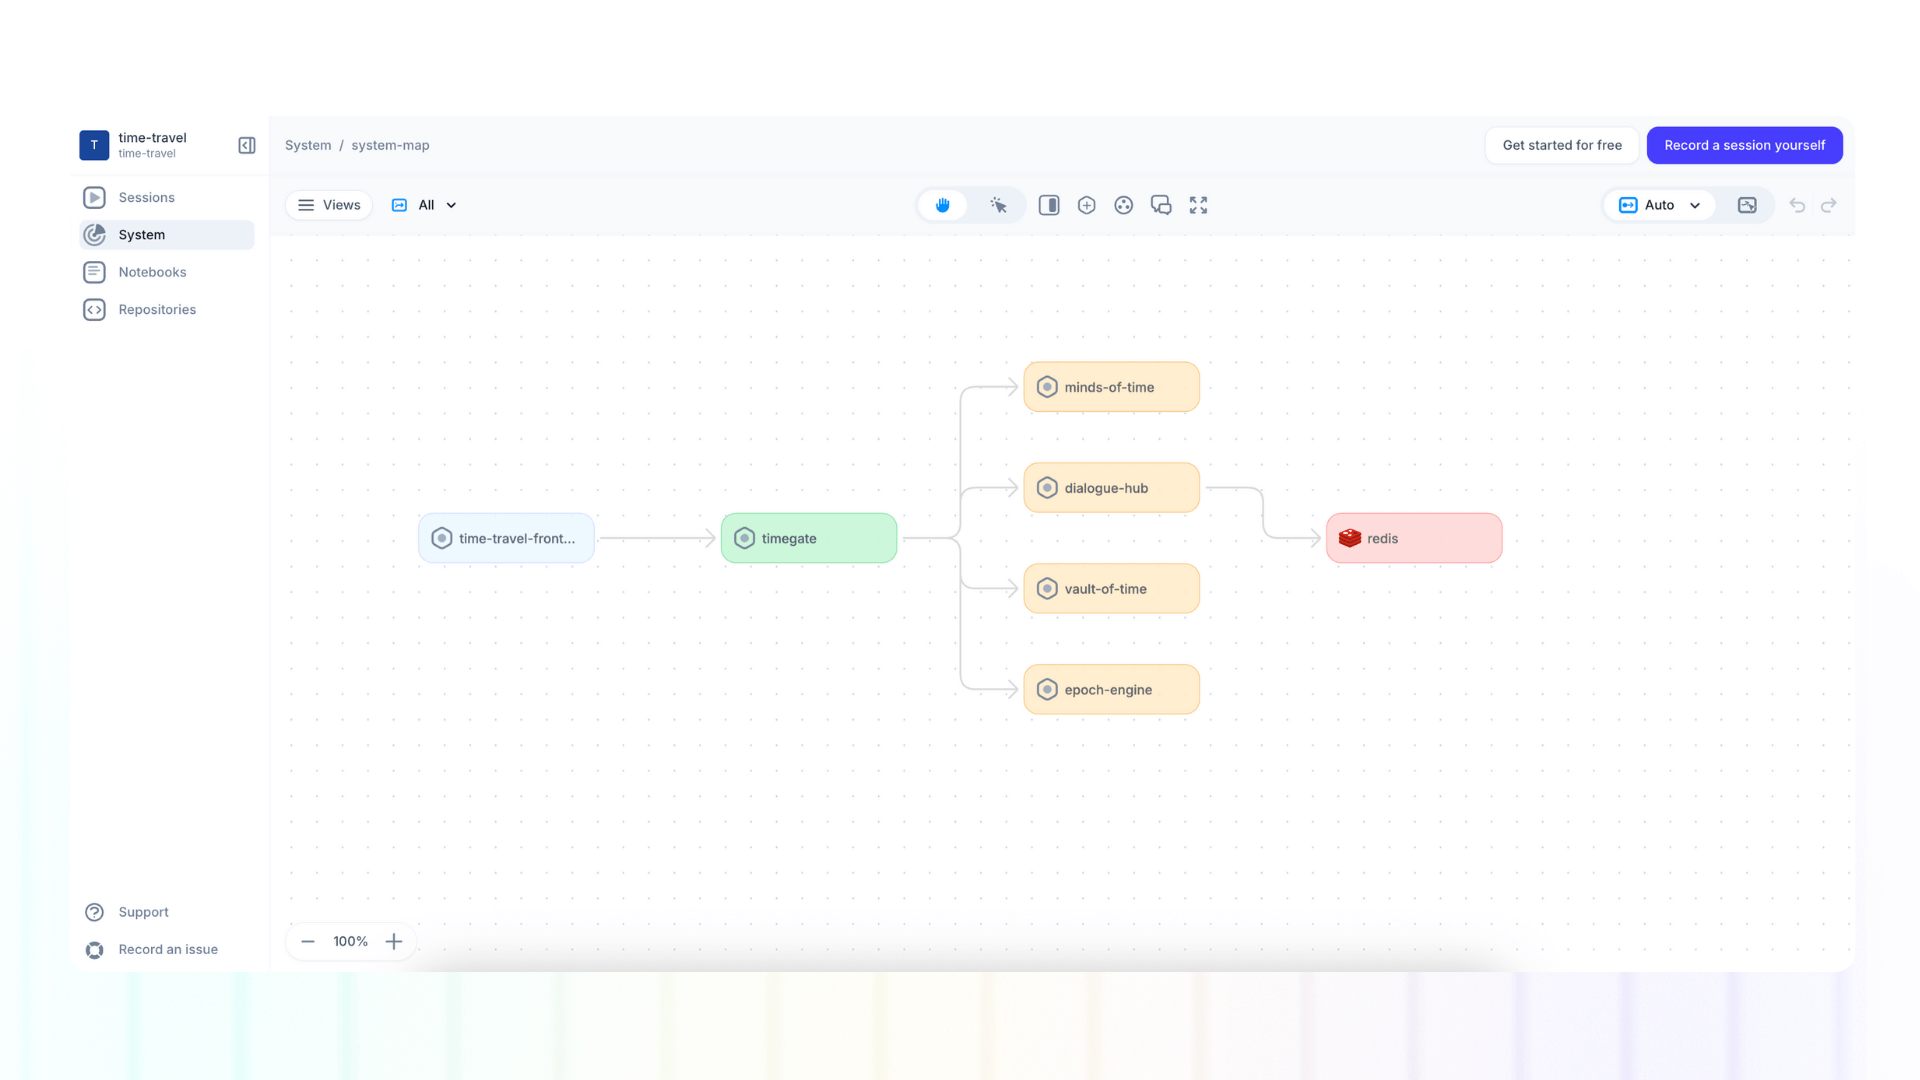
Our first step toward reducing the manual overhead of architecture documentation was leveraging the information collected with full stack session recordings to auto-document your system.
Our second step was to allow you to visualize this information as a dashboard. This was a major leap forward: engineering teams finally had real-time visibility into their distributed systems, without hours spent on whiteboards or Zoom calls trying to reconstruct the big picture.
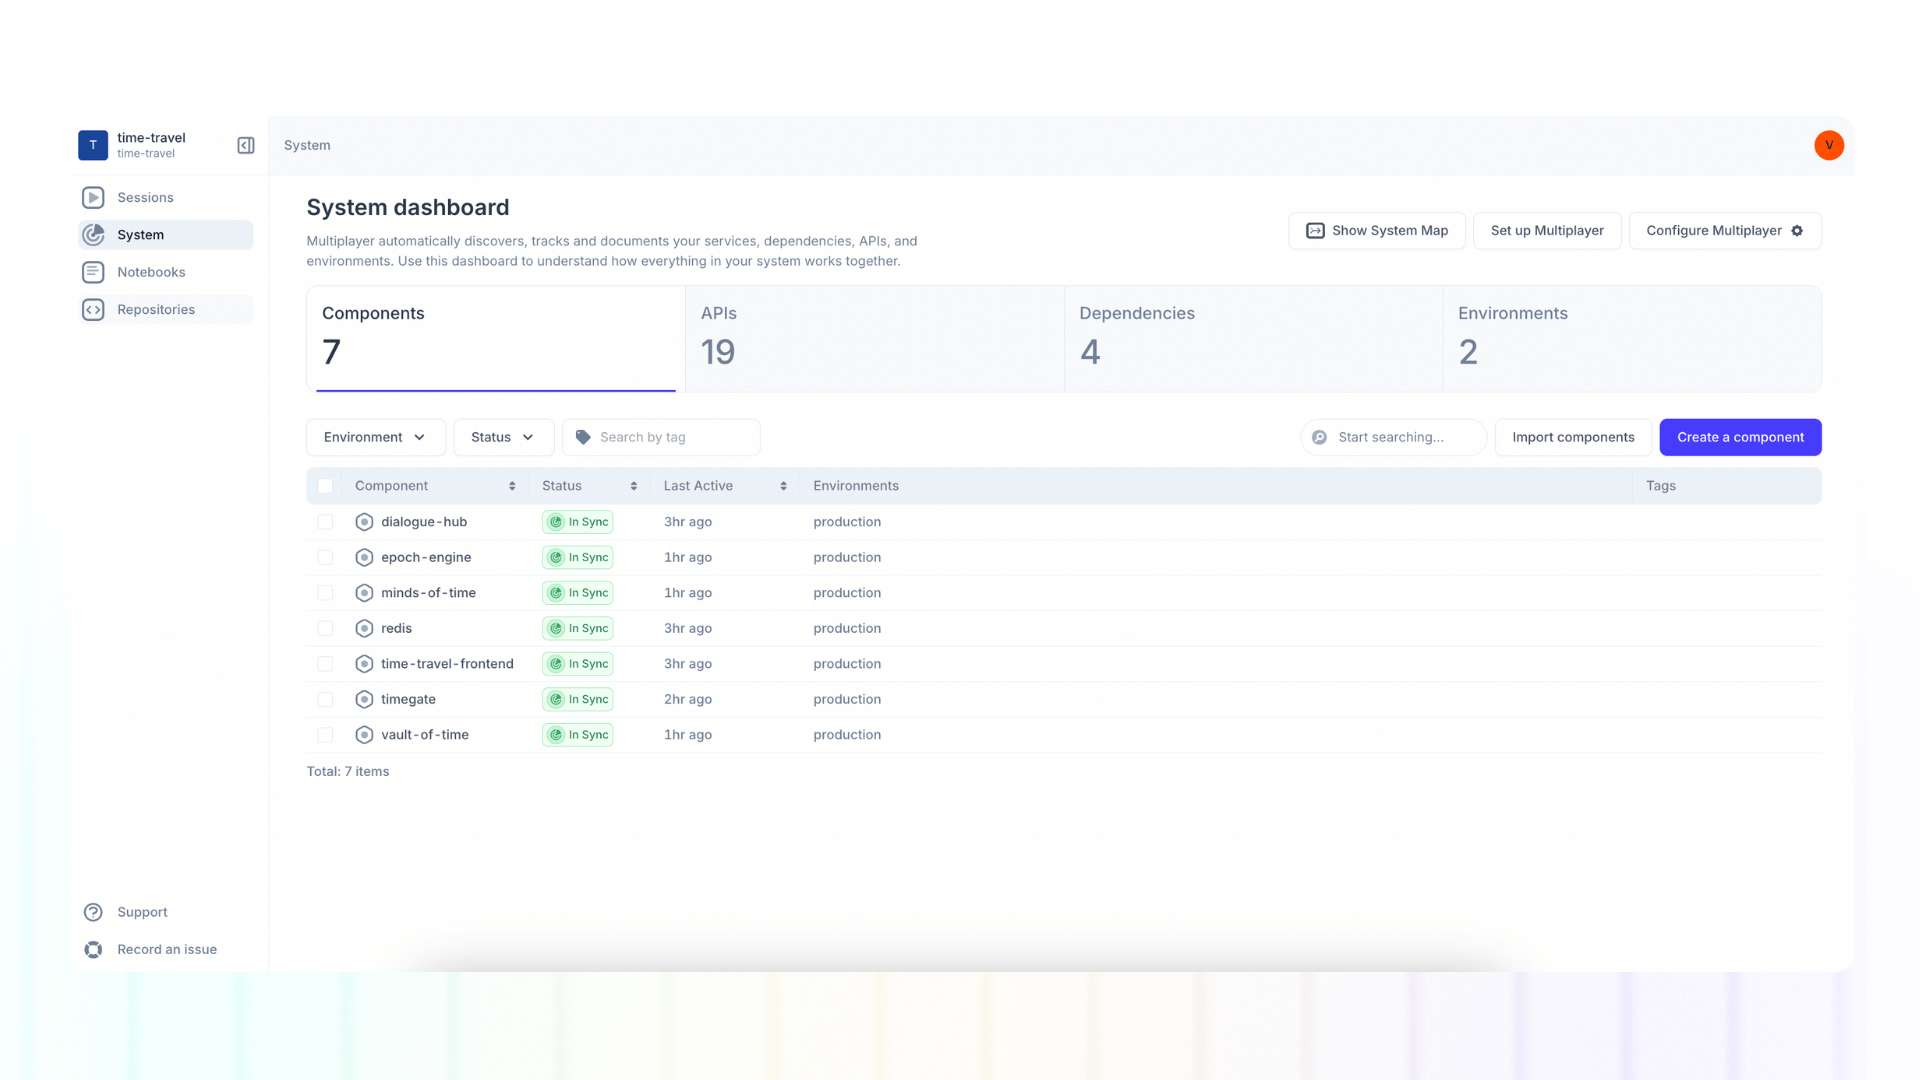
With our latest release, we’ve taken that automation one step further. Now, those auto-detected components and dependencies can be used to instantly generate your system map.
👀 If this is the first time you’ve heard about Multiplayer, you may want to see full stack session recordings in action. You can do that in our free sandbox: sandbox.multiplayer.app
If you’re ready to trial Multiplayer you can start a free plan at any time 👇