Multiplayer 2025: year in review
In 2025 we focused on a simple but ambitious goal: making debugging faster, less fragmented and less manual. Check out all our releases to make that possible.

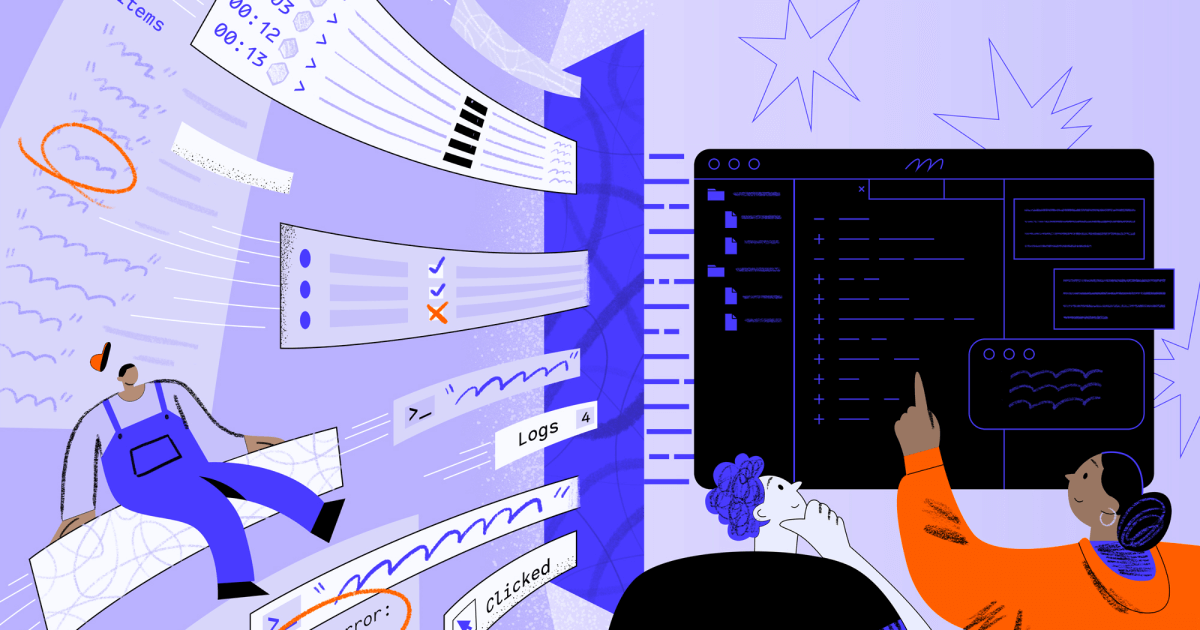
2025 was a defining year for Multiplayer.
We focused on a simple but ambitious goal: making debugging faster, less fragmented and less manual. That meant meeting developers where they were already working and capturing the right context at the right time.
Across the year, Multiplayer evolved from a powerful session recording tool into a full workflow for understanding what actually happens in production - from the user’s screen all the way to deep backend calls - and acting on that knowledge faster.
Here’s a look back at what we shipped in 2025, and where we’re headed next.
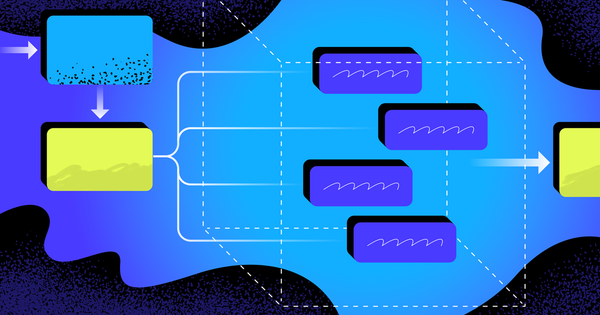
Full stack session recordings
At the core of Multiplayer is the idea that debugging starts with context. This year, we significantly expanded how that context is captured, shared, and used.
- Multiple recording modes: You’re in control of what gets captured and when. Record on-demand when users hit issues, or run continuous recording in the background to automatically capture issues and exceptions. No more "I wish we had been recording when that happened."
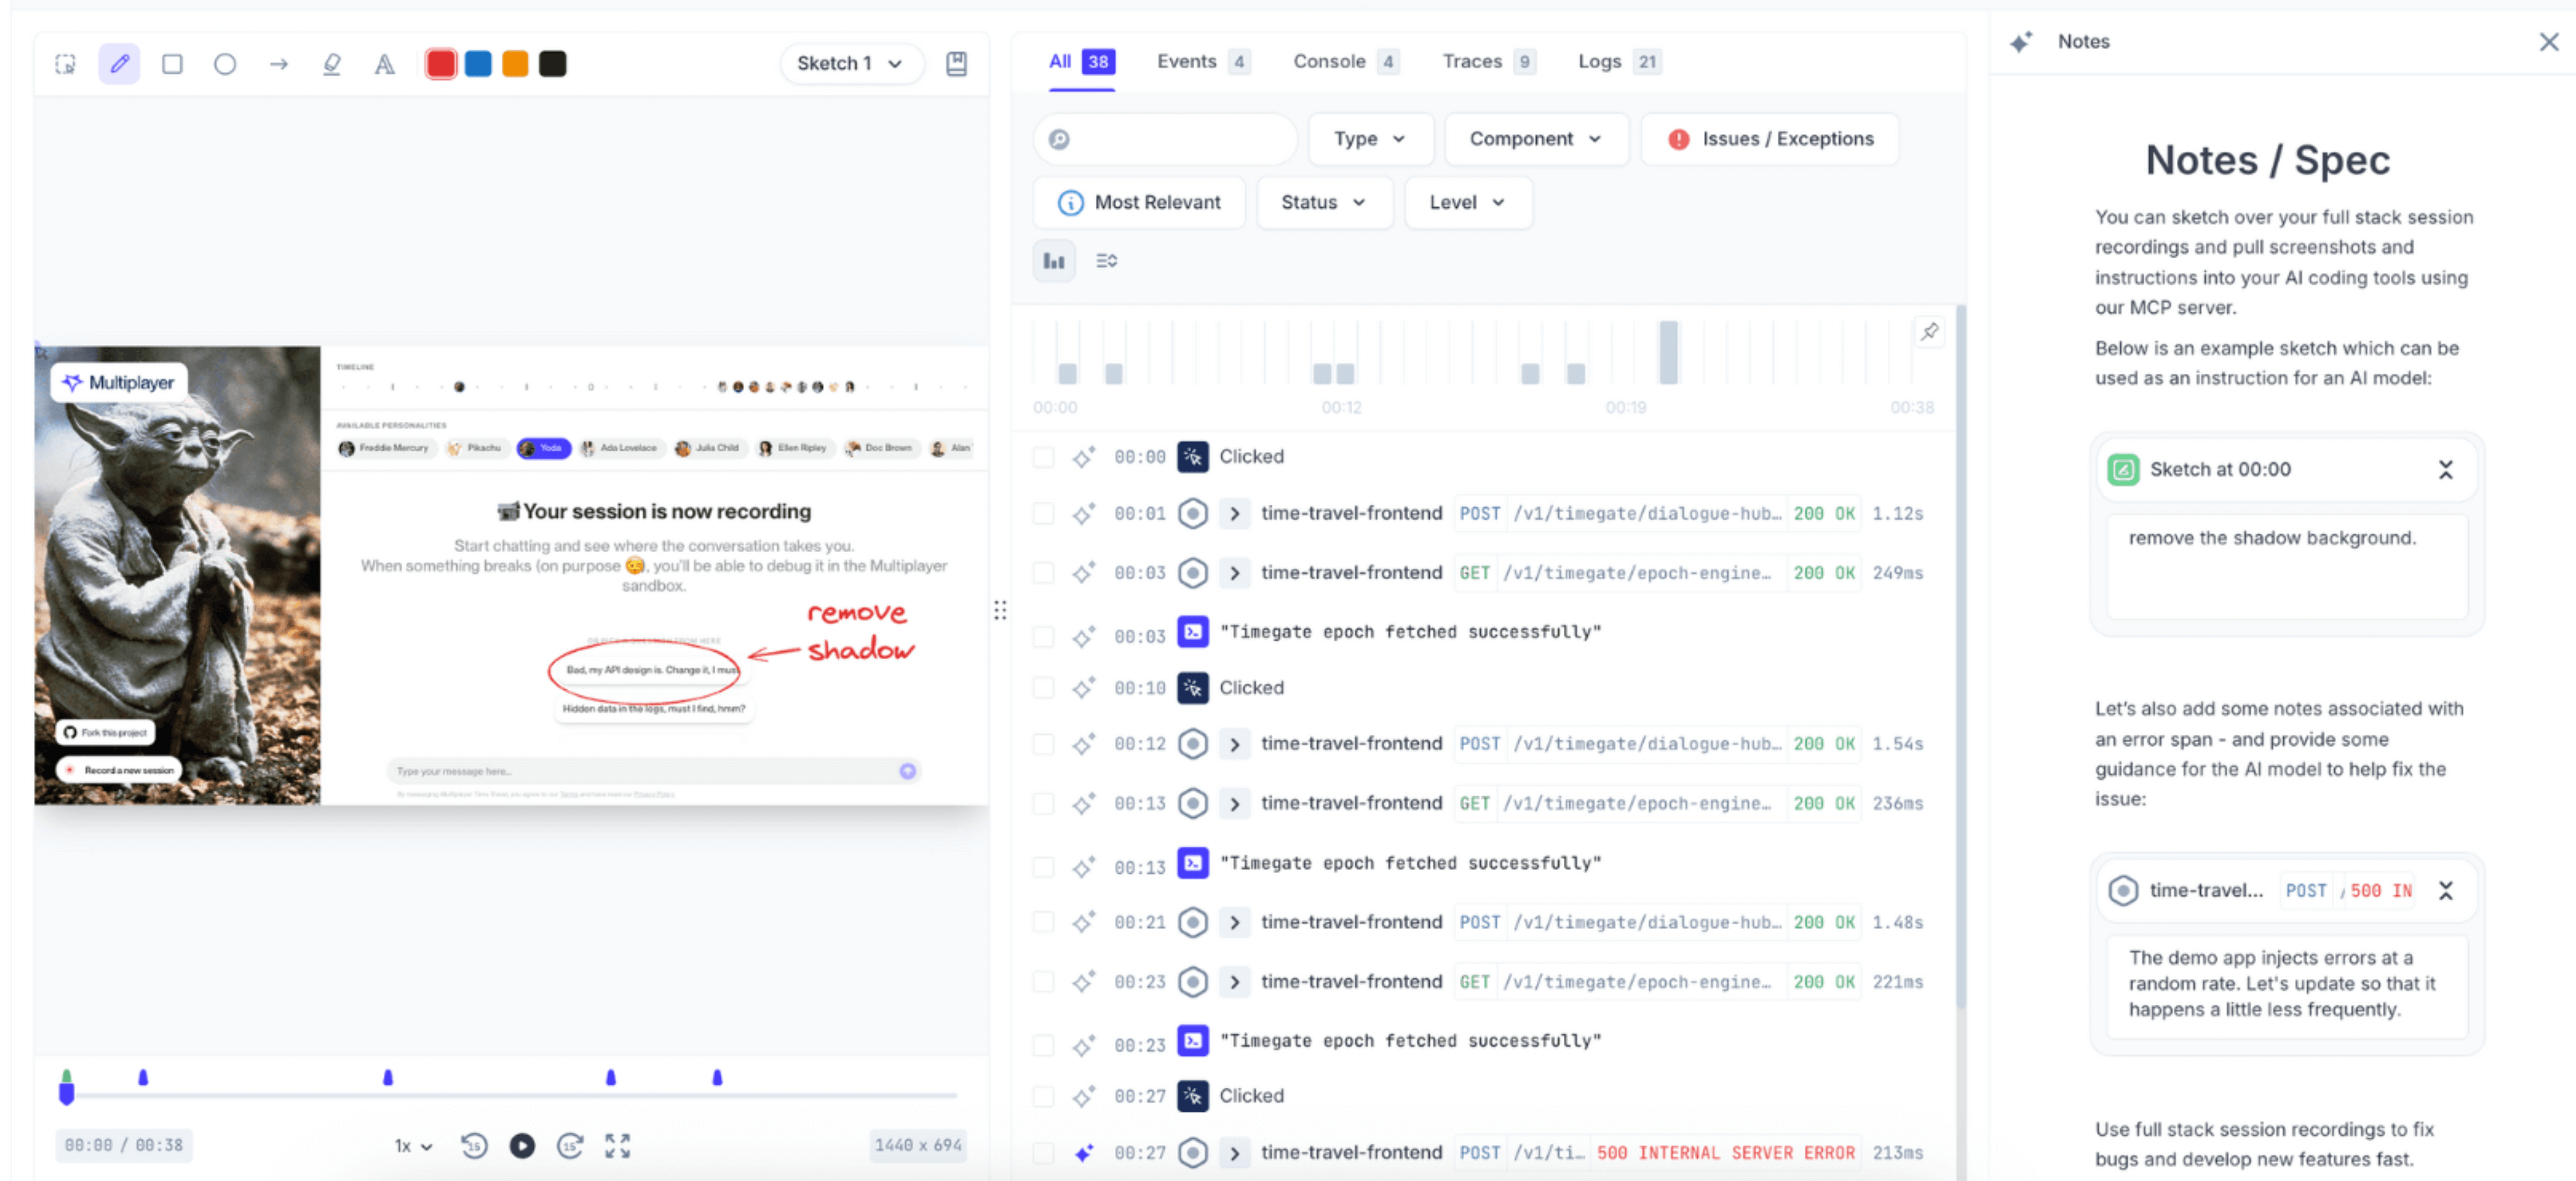
- Annotations: Sketch directly on recordings and annotate any data point collected, from individual timestamps to clicks, traces, and spans. Your team has all the context they need to understand exactly where the UI broke or which log entry needs investigation.
- Mobile support: We've shipped React Native support, bringing the same full stack recording capabilities you have on web to your mobile applications. Whether you're troubleshooting a checkout flow on iOS or diagnosing API failures on Android, you get the complete picture.
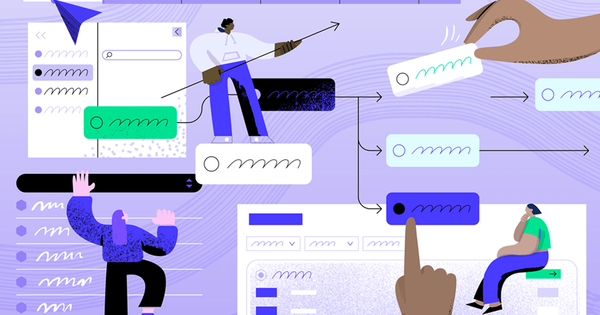
AI-powered workflows
AI tools are only as useful as the context you give them. In 2025, we focused on making Multiplayer a high-quality data source for AI-assisted debugging.
- MCP server: brings full stack session recordings into MCP-compatible AI tools like Cursor, Claude Code, Copilot, Windsurf, and Zed. Instead of feeding your IDE partial context, you give it everything: frontend replays, user actions, backend traces, logs, request/response payloads, and your team's annotations.
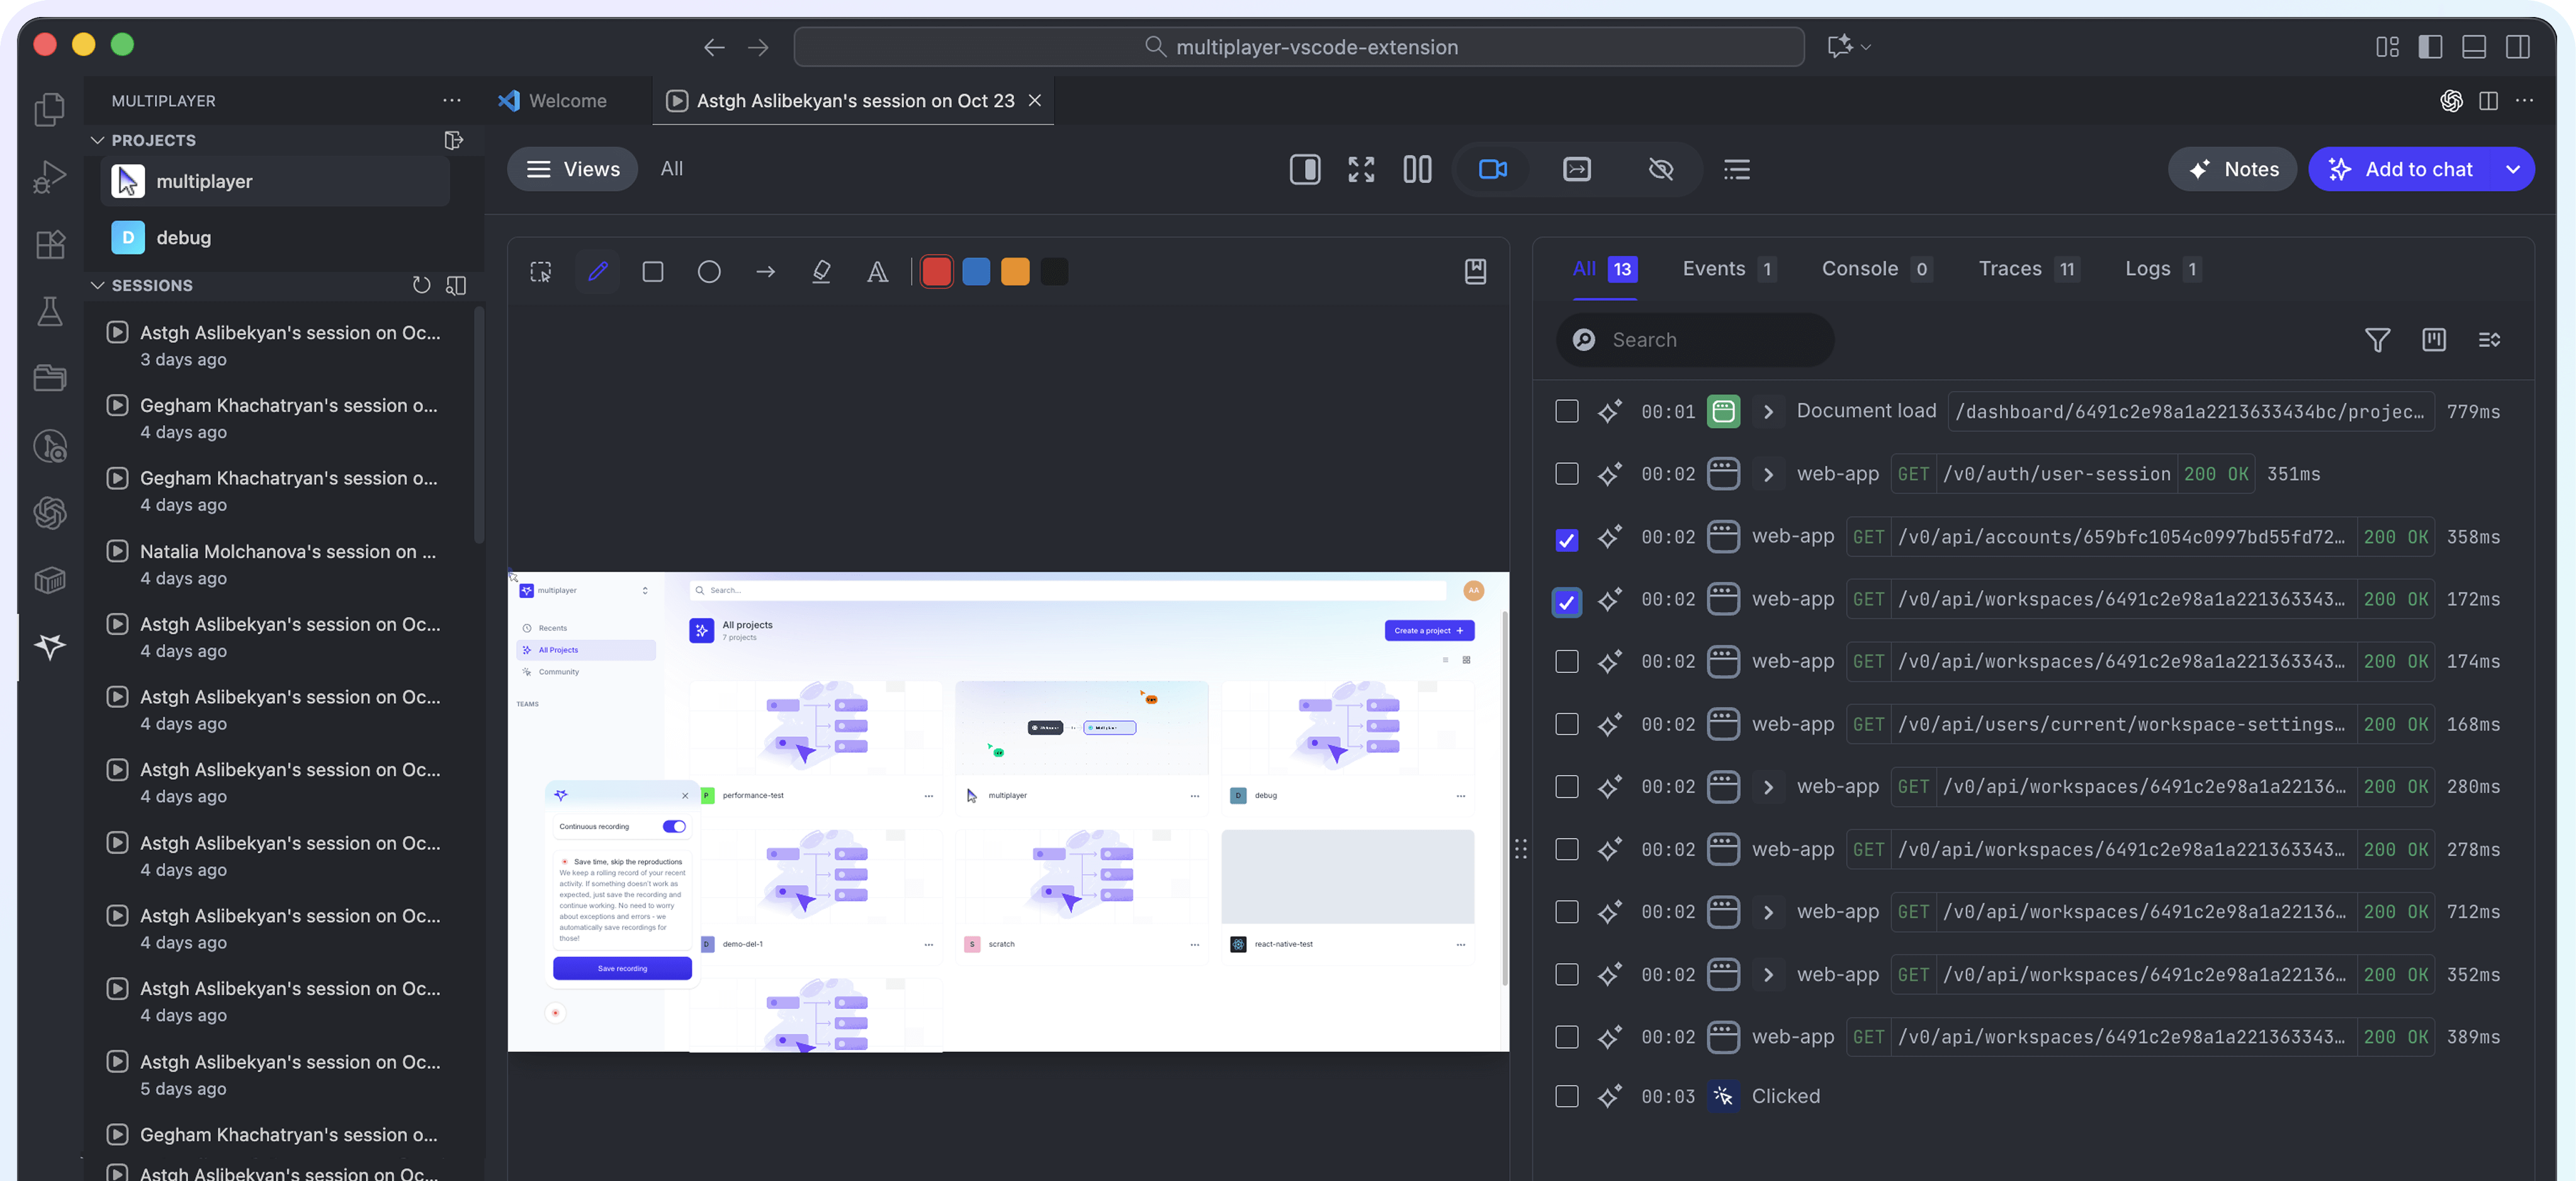
- VS Code extension: Your full stack session recordings are now available directly in your editor: pull up any recording, review frontend screens, backend traces, logs, request/response content and headers, and jump to the exact line of code where an error occurred.
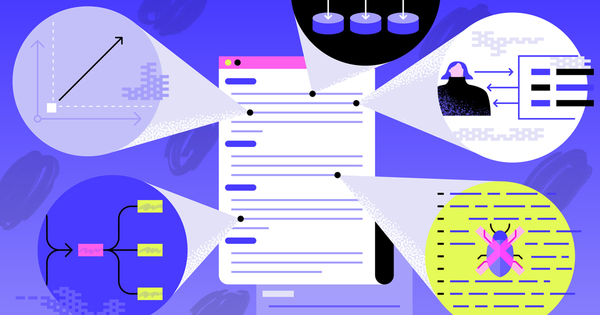
Full cycle debugging
Debugging doesn’t end when the issue is fixed. It’s also about learning, documenting, and preventing regressions.
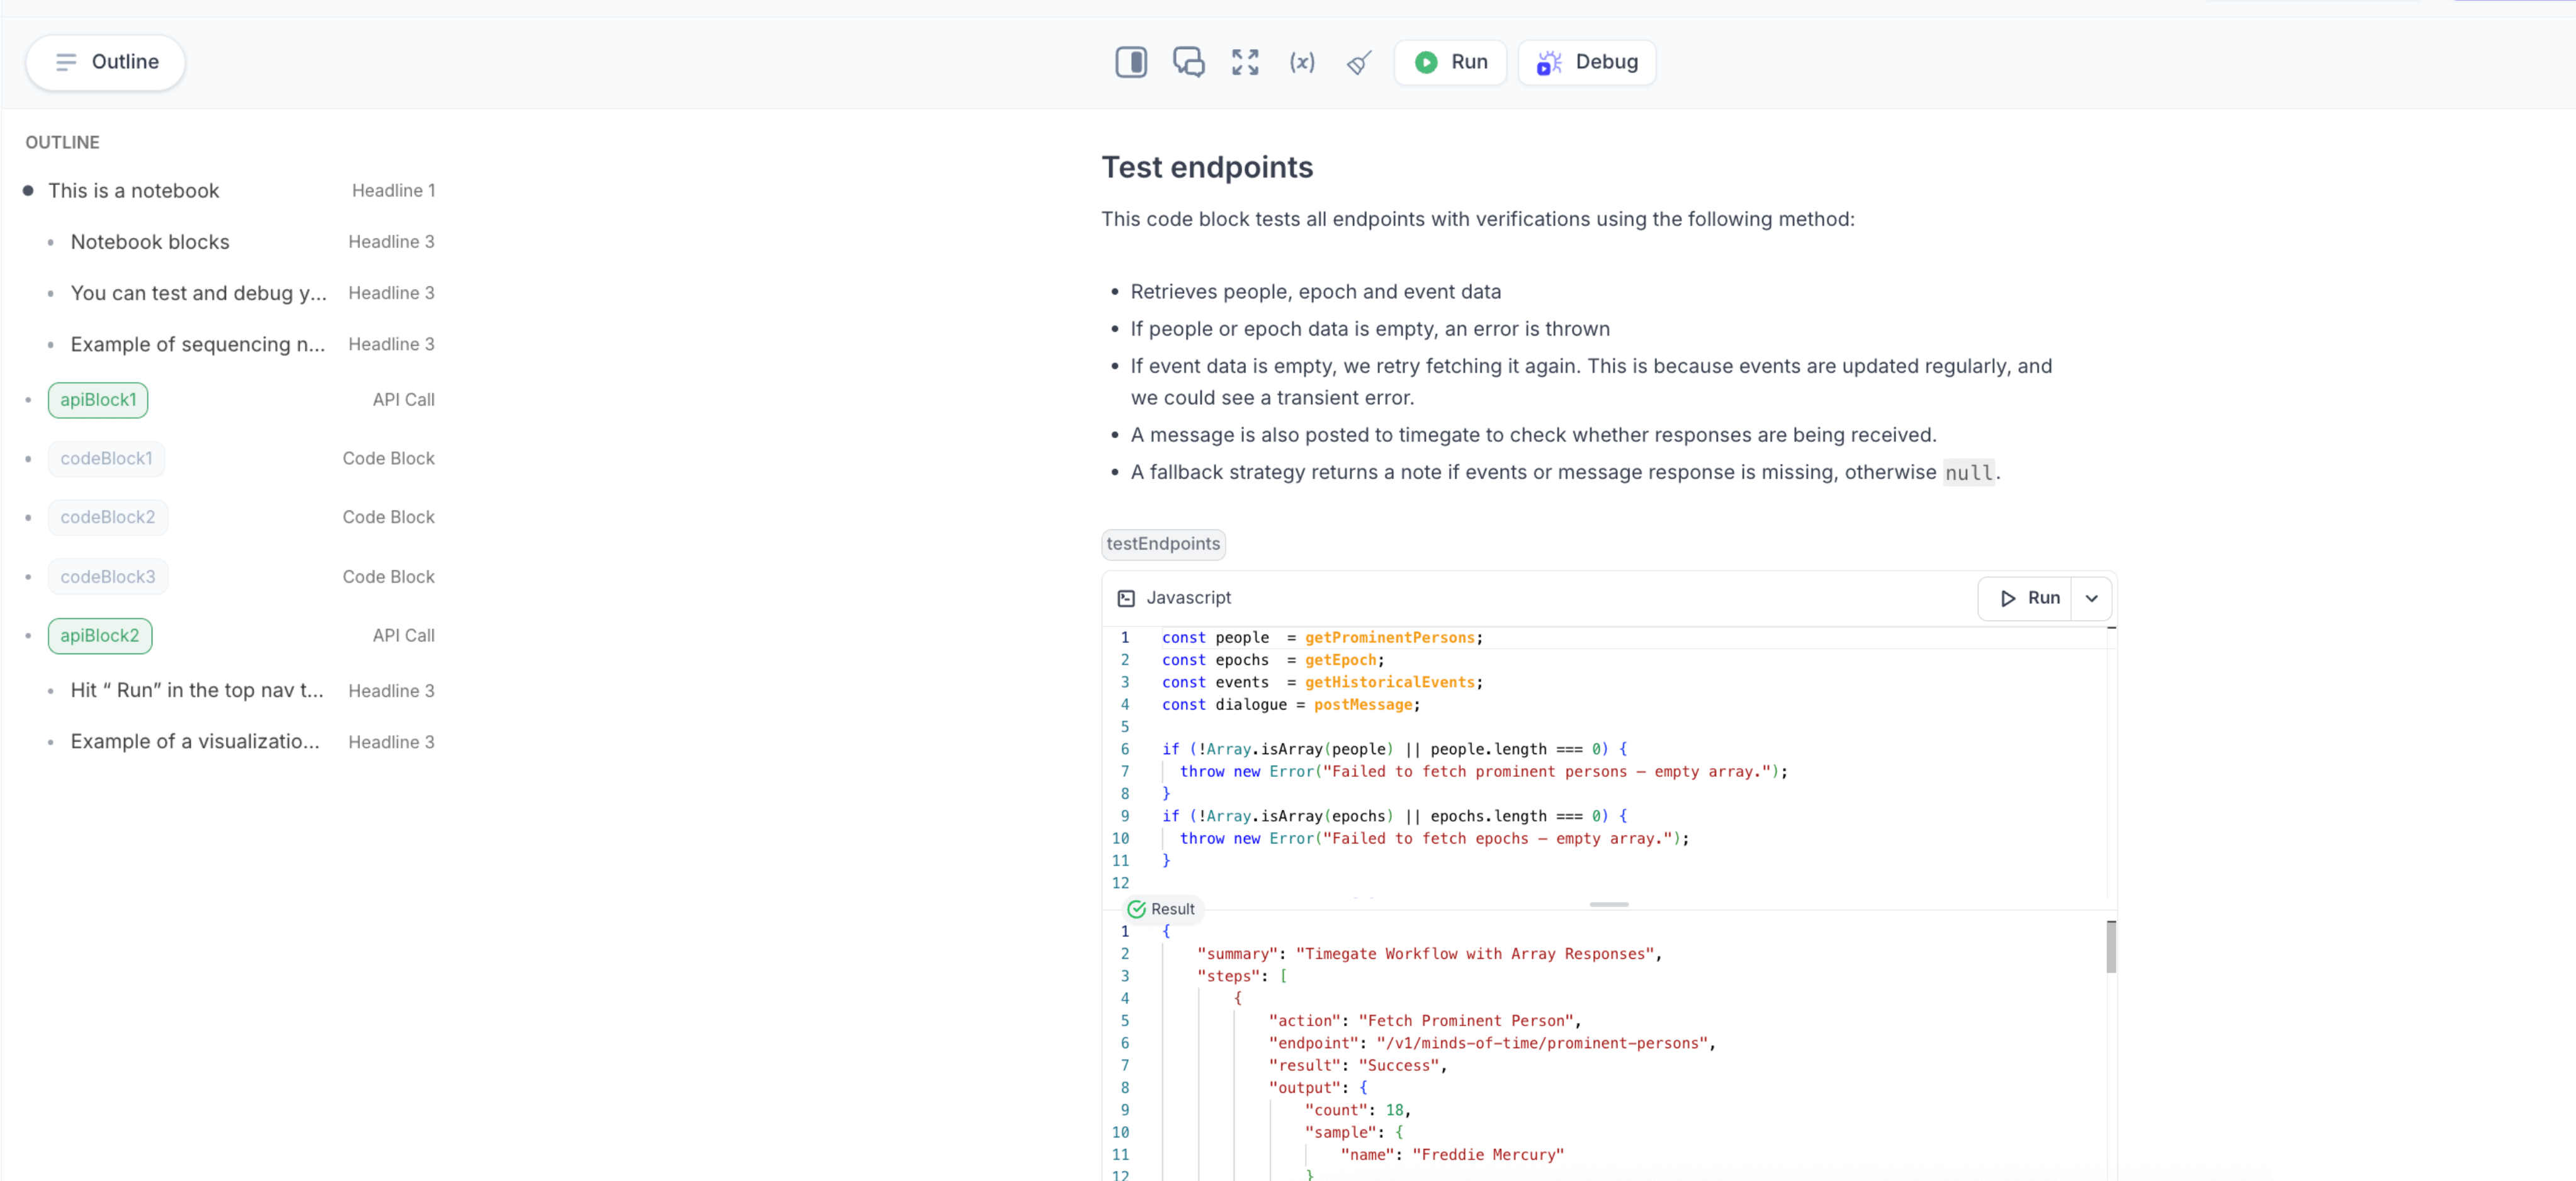
- Notebooks: An interactive sandbox for designing, debugging and documenting real-world API integrations. You can also automatically generate test scripts from your full stack session recordings to verify fixes, document real behavior, and prevent regressions.
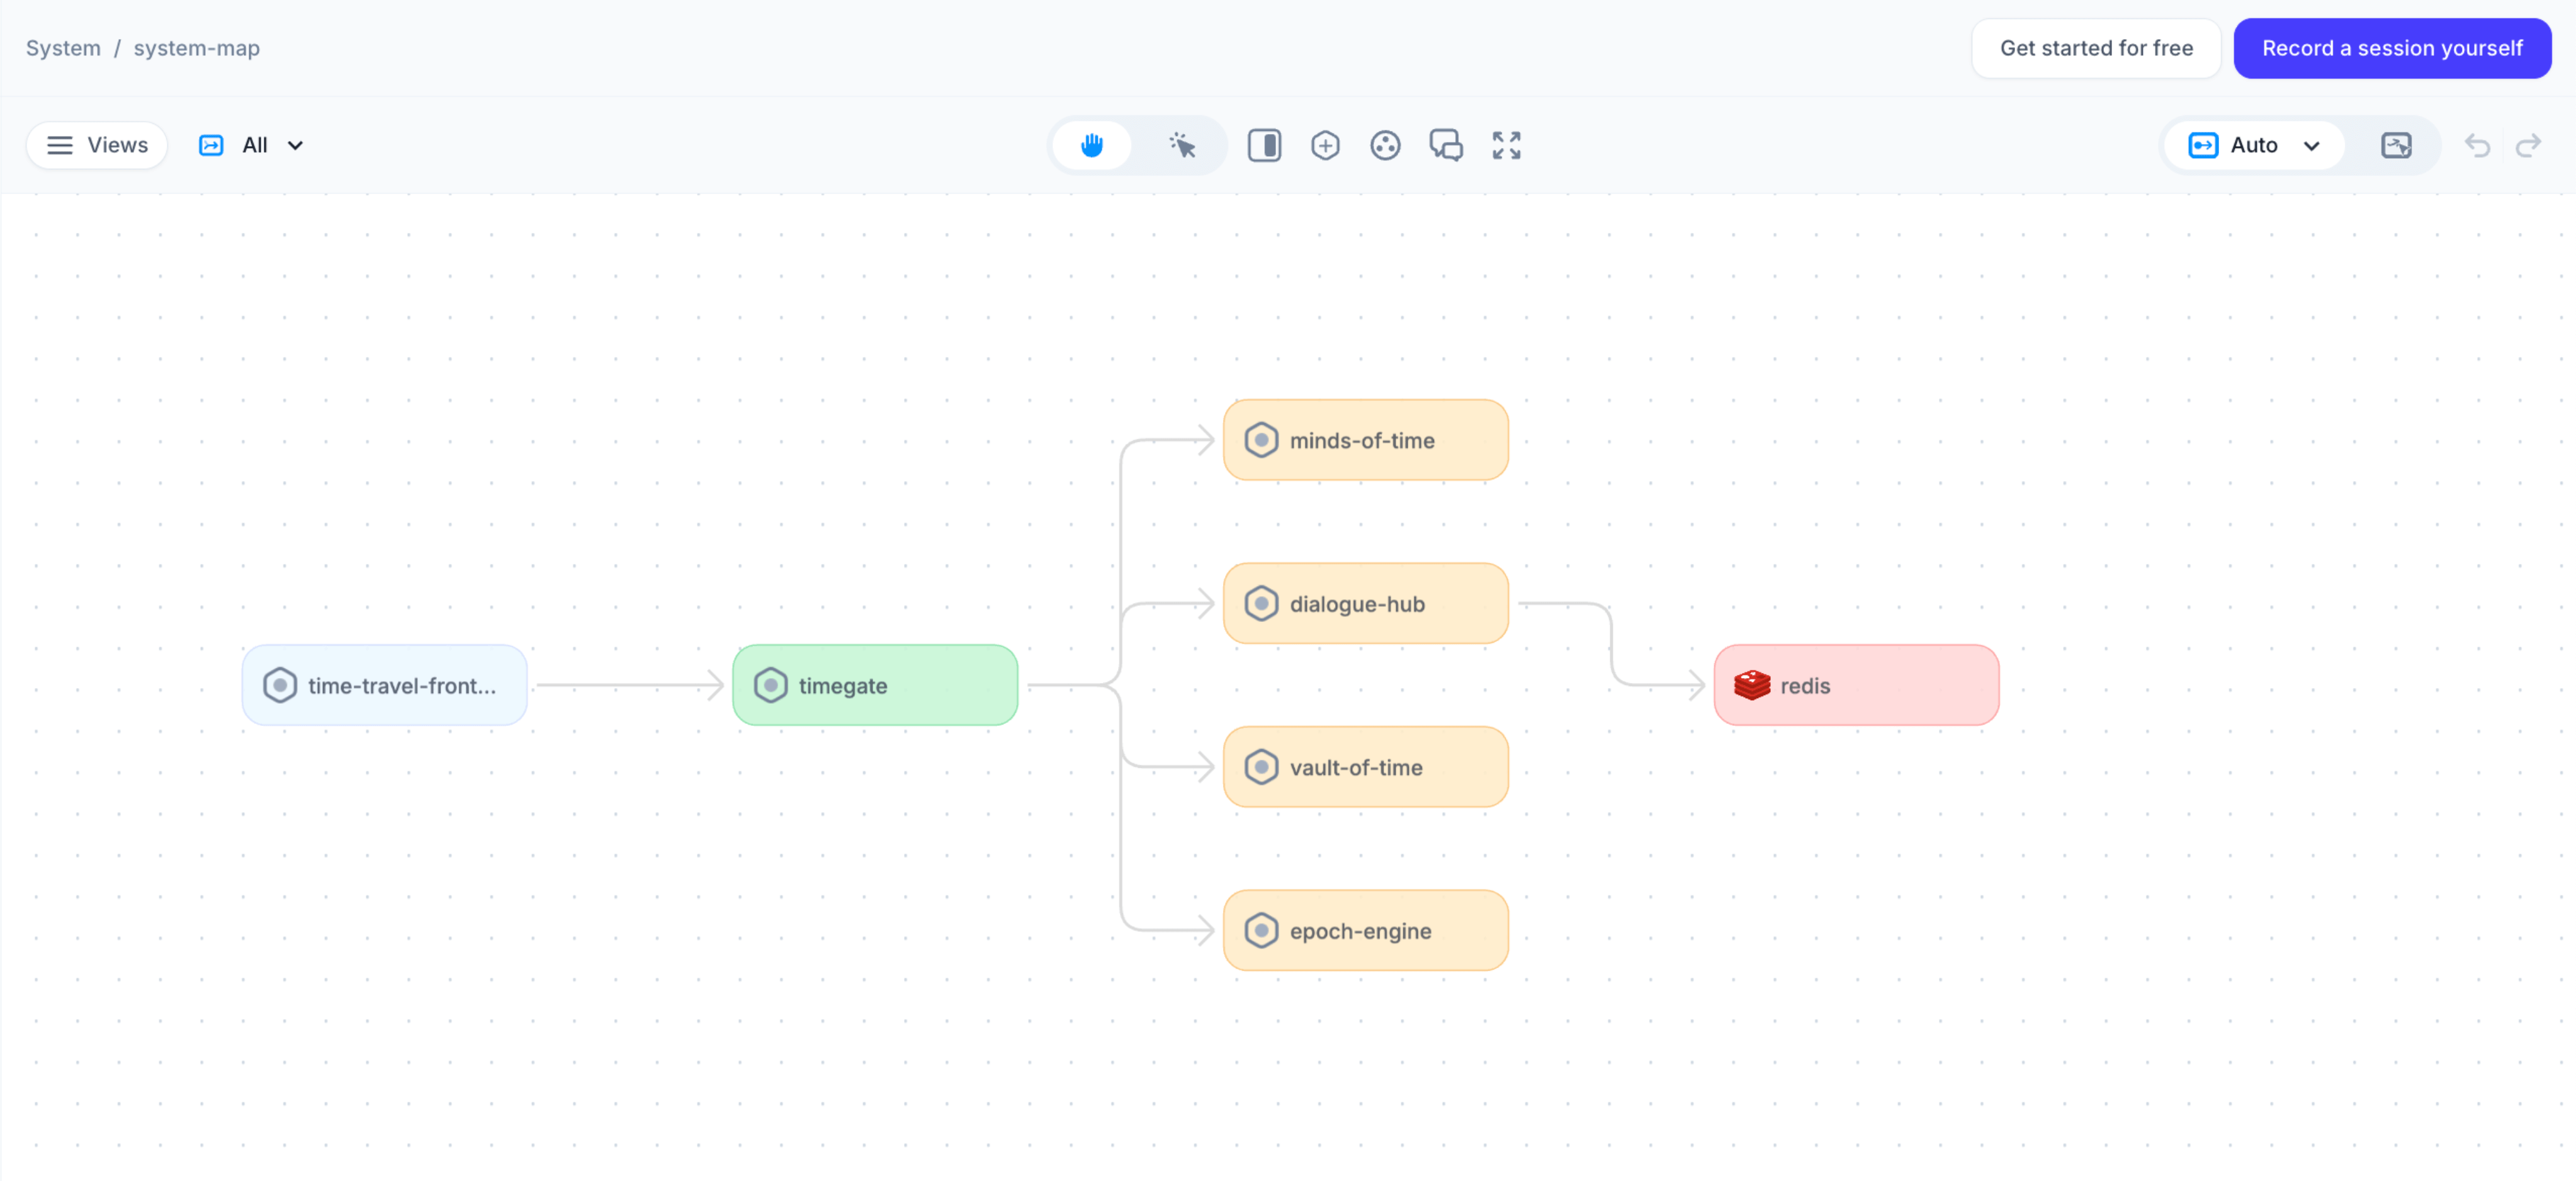
- System architecture auto-documentation: Automatically map all your components, dependencies, and APIs and visualize your application's structure. No more outdated, manually-drawn architecture diagrams - your system maps stays current as your system evolves.
Better onboarding & resources
We also invested heavily in making Multiplayer easier to adopt and understand.
- A major documentation overhaul with 34+ new pages covering: use case examples, tool comparisons (FullStory, LogRocket, Sentry, and others), technical deep-dives on recording modes and data collection
- Streamlined onboarding with framework-specific setup guides for React, Next.js, Angular, and Vue.js. Getting the in-app widget running takes just minutes.
- A free sandbox and demo app to experience full-stack session recordings before installing anything.
What's next: 2026 roadmap
The features below are currently in private beta with design partners and enterprise customers, and are planned for GA in early 2026.
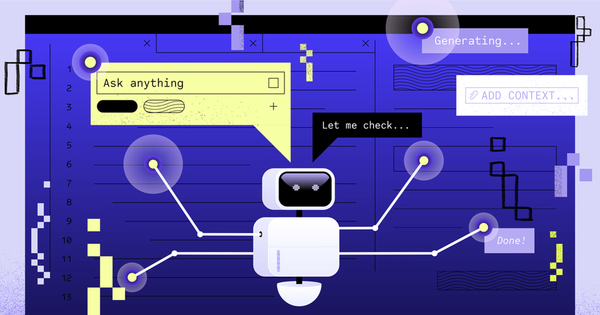
Multiplayer AI agent
Automatically receive suggested fixes and pull requests based on issues identified in session recordings.
Today, teams manually feed recordings into AI tools. With the Multiplayer AI agent, this workflow becomes automated: instead of alerts, developers receive actionable PR suggestions grounded in real production context.
Conditional recording mode
Automatically record sessions for specific users or conditions, without manual start/stop and without “always-on recording” overhead.
This allows teams to capture issues even when users don’t report them, eliminating incomplete tickets and giving engineers immediate, actionable context.
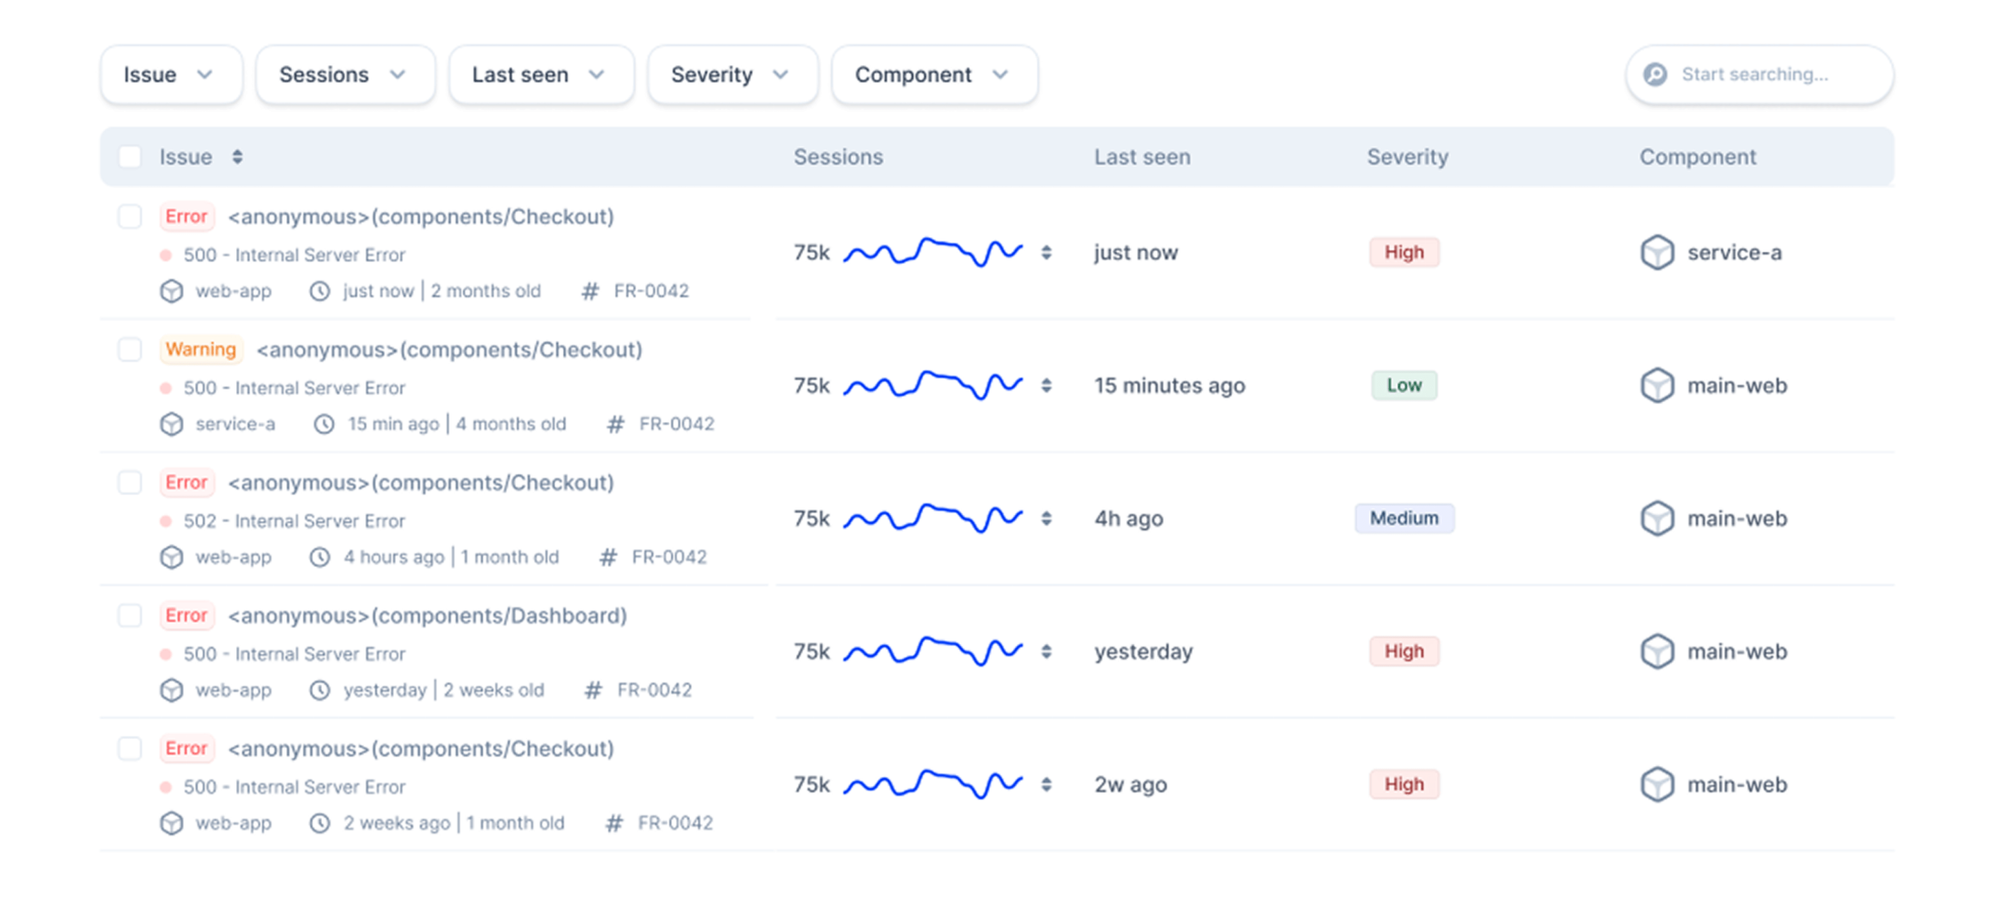
Issue tracking
A unified view of errors, exceptions, and performance issues across frontend and backend, all linked to the sessions where they occurred.
User tracking
View all active users and remotely trigger recording conditions during live sessions. Ideal for testing, debugging, and high-touch support scenarios.
Slack integration
Get notified when recordings are created and share session links directly in Slack, keeping context close to where conversations already happen.
Thank you!
None of this would be possible without the teams who trusted Multiplayer in production, shared feedback candidly, and pushed us to build something better.
Thank you to our users, design partners, community members, and everyone who challenged us to think deeper about debugging, support, and how engineers actually work.
We’re excited for what’s ahead in 2026 and grateful to be building it together. 💜
👀 If this is the first time you’ve heard about Multiplayer, you may want to see full stack session recordings in action. You can do that in our free sandbox: sandbox.multiplayer.app
If you’re ready to trial Multiplayer you can start a free plan at any time 👇