Four key practices to reduce Mean Time to Resolution (MTTR)
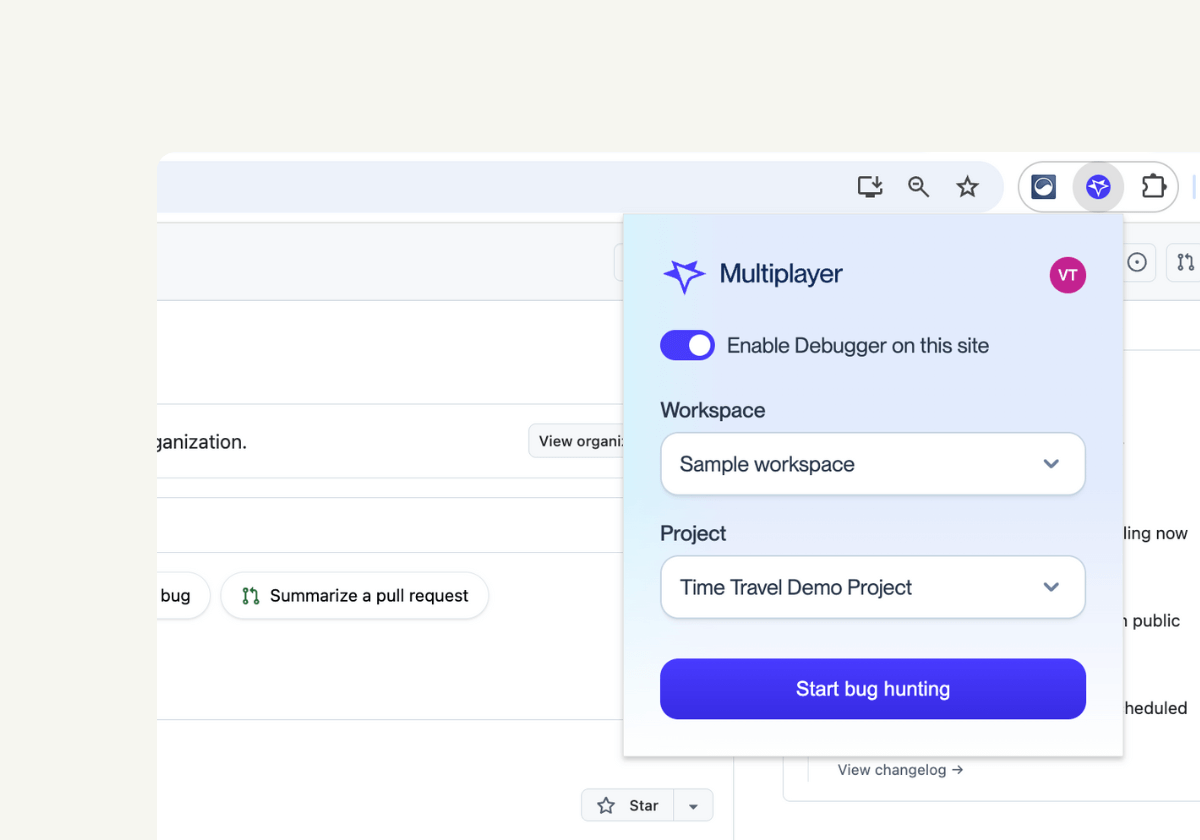
With the new Multiplayer browser extension, you can start capturing full stack session recordings instantly, right from your browser.


Distributed debugging isn’t just traditional debugging at scale, it’s an entirely different challenge. It means diagnosing and fixing issues that span multiple services, layers, and sometimes even teams, across complex and often legacy architectures.
These aren’t just bugs. They’re emergent behaviors, cascading failures, and tricky edge cases that don’t show up until just the right (or wrong) combination of conditions is met.
Here’s what makes distributed systems especially hard to debug:
- Unpredictable failures are inevitable. In a system running on a single machine, hardware-level issues like memory corruption are rare. But at the scale of tens of thousands of machines, something is always broken. You can’t eliminate failures: you have to design for them, detect them quickly, and recover quickly.
- Failures have multiple root causes. In complex systems, incidents are rarely caused by a single issue. More often, they’re the result of several factors aligning: an overloaded service, a misconfigured retry, a recent deploy. This makes incident analysis far more about understanding the context than isolating a single line of faulty code.
- Non-deterministic behavior is common. Distributed systems introduce uncertainty: network delays, retries, clock skew, and asynchronous workflows all create variability. The same inputs won’t always produce the same results, which makes consistent reproduction one of the hardest parts of debugging.
- Concurrency and inter-process interactions create hidden chaos. Multiple services run in parallel, often communicating asynchronously. Debugging across these boundaries requires stitching together logs, traces, and system state.
- No one has the full picture. Modern systems are too large and too fast-moving for any single engineer to have a complete mental model of the entire system. As systems scale, knowledge fragments, and institutional knowledge gets lost. Debugging becomes not just a technical task, but a coordination challenge across people, tools, and documentation.
Four key practices to reduce Mean Time to Resolution (MTTR)
Mean Time to Resolution (MTTR) measures how quickly your team can detect, diagnose, and resolve issues, minimizing downtime and user impact. It's one of the most critical metrics for engineering teams, yet in modern distributed systems, fast resolution remains frustratingly difficult.
The problem isn't lack of effort. It's lack of context. Bugs surface unpredictably, evidence is scattered across multiple tools, and by the time someone reports an issue, the technical context has already disappeared or been sampled away.
To improve MTTR, teams need practices and tooling that reduce friction at every stage of debugging. Here are four critical ones:
1. Capture complete technical context automatically
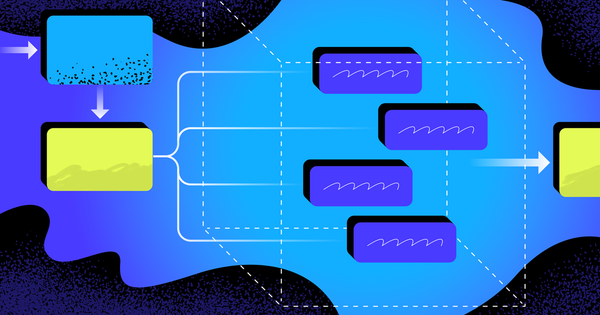
Most bugs span the entire stack: a confusing UI stems from a malformed API response, which traces back to a slow database query, which connects to a misconfigured service. Yet traditional debugging methods force you to hunt across multiple platforms: session replay for frontend, APM for traces, logs for errors, database tools for queries.
Multiplayer automatically correlates everything. When something goes wrong, you get the complete technical story: the user's interactions, the API calls they triggered, the backend traces that processed those requests, and the database queries that executed. All in one timeline, with zero manual correlation.
No jumping between tools. No guessing at timestamps. No missing context because something was sampled away. The evidence exists, automatically captured and connected, the moment an issue occurs.
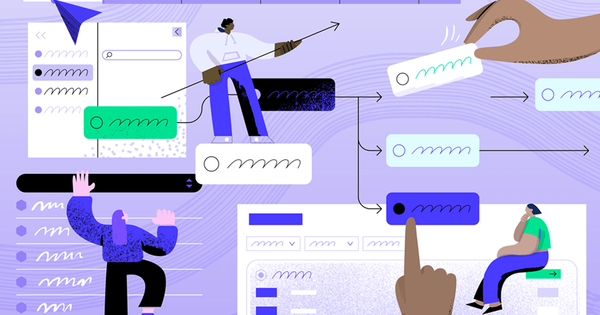
2. Start from the technical event, not the symptoms
Traditional debugging workflows start with symptoms: "users report the checkout is broken." Then comes the archaeology: searching logs, filtering APM traces, trying to find relevant sessions, hoping you can piece together what happened.
Multiplayer inverts this. It captures sessions triggered by technical events across your stack: API failures, performance degradation, exceptions, critical business flows. When something goes wrong, the evidence is already there, complete and contextualized.
Instead of starting with vague user reports and working backward, you start with the technical moment something broke: the exact request, the stack trace, the database state, the user's actions, all captured together. Your team spends time fixing issues, not hunting for clues.
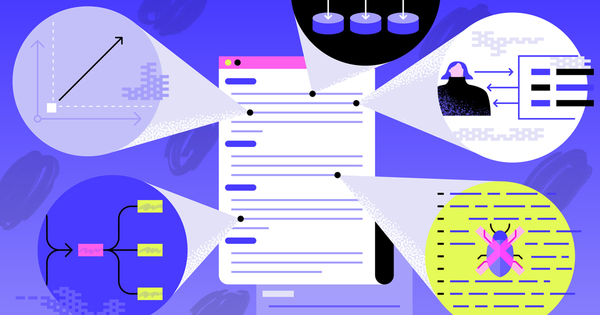
3. Turn debugging sessions into executable test cases
Reproducing bugs in distributed systems is notoriously difficult. By the time someone reports an issue, the database state has changed, authentication tokens have expired, or timing-dependent race conditions are impossible to recreate manually.
Multiplayer lets you generate executable Notebooks directly from captured sessions. The system auto-captures all relevant API calls, authentication headers, request payloads, response data, and execution logic, then transforms it into a runnable test script that reproduces the exact conditions where the bug occurred.
Developers get immediately reproducible test cases instead of vague reproduction steps. QA can verify fixes against real failure scenarios. The same session that revealed the bug becomes the test that prevents regression.
4. Make debugging insights shareable across teams
Bugs don't exist in isolation: they require collaboration between frontend engineers, backend developers, DevOps, support, and sometimes external vendors. Yet traditional tools trap context in formats that don't translate: log files backend engineers understand might not mean much to support.
Multiplayer makes technical context universally understandable. Record a full stack session replay and then annotate it with your comments.
Draw on the UI where something broke, add timestamp notes explaining what should happen, highlight the failing API trace, sketch proposed fixes. Support can document customer issues with full technical detail. Engineers can leave visual feedback on implementations. Teams can communicate across disciplines using the actual behavior of the system.
The same annotated session that helps support explain a customer issue becomes the specification engineers use to fix it—and the test case QA uses to verify it.
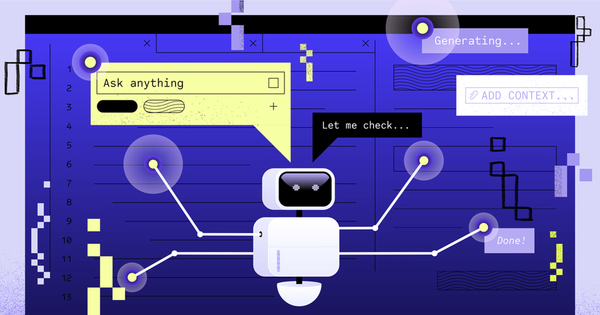
How to use the Multiplayer
We’ve talked about the best practices to reduce MTTR in distributed systems, now here’s how to put them into action, faster.
Multiplayer is designed to adapt to every support and debugging workflow, and today we're releasing our browser extension.
Now we support:
- Three install options (in-app widget, browser extension, SDK/CLI apps)
- Three recording modes (on-demand, continuous, conditional)
- Multiple options on how to send telemetry data (and how much) to Multiplayer and how to deploy (self-hosted or cloud)
It's a "choose-your-own-adventure" type of approach so that teams can mix and match the install options, recording modes and backend configuration that best fits their application needs.
👀 If this is the first time you’ve heard about Multiplayer, you may want to see full stack session recordings in action. You can do that in our free sandbox: sandbox.multiplayer.app
If you’re ready to trial Multiplayer you can start a free plan at any time 👇